
Beat the Market Using Option Prices
I recently read The Intelligent Option Investor, and it had a novel approach to evaluating stock prices. It uses the Black Scholes Model (BSM) combined with options prices to tell us the market’s forecast of future stock prices. This article walks through creating a Streamlit app that will automate this process for us. If you want more of an overview of the book and some of the options strategies, check out my previous article here:
How Does the BSM work?
The BSM is an equation for pricing options using the risk-free interest rate, the current price of the stock, the volatility of its price movement, and the duration of the contract. The risk-free rate is a measure of the general upward trend you would expect of most stocks (10-year treasury). The contract duration matters because a longer contract gives the stock more time to move and therefore makes the option more valuable.
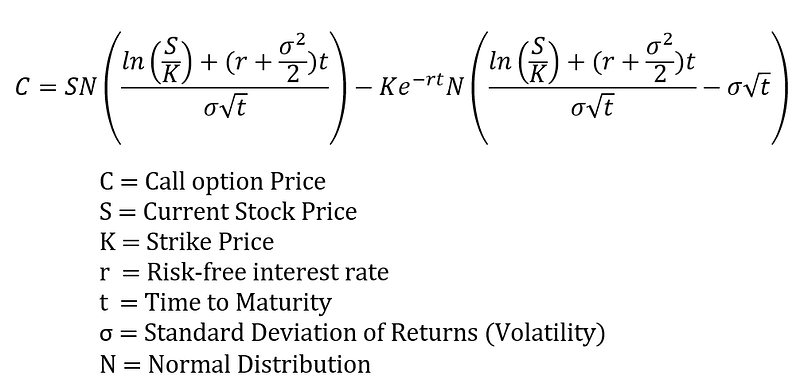
I include the formula here only to give a sense of the variables that matter. Using the market quotes for prices on the stock & options along with the fact that we know the contract length and risk-free rate, we can calculate the volatility of the stock that is implied through the prices. The model assumes that the price distribution is log-normal.
Implied Volatility Over Time
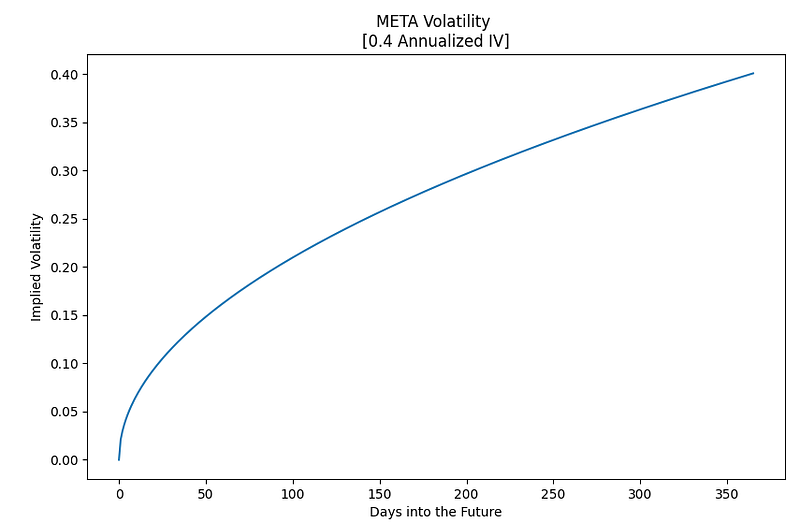
Fortunately, most sites that display option chains calculate the implied volatility for us on an annual basis. The volatility changes at a rate tied to the square root of time.
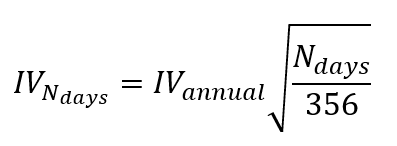
The square root of time produces a sideways parabola shape.
Stock Price Distribution
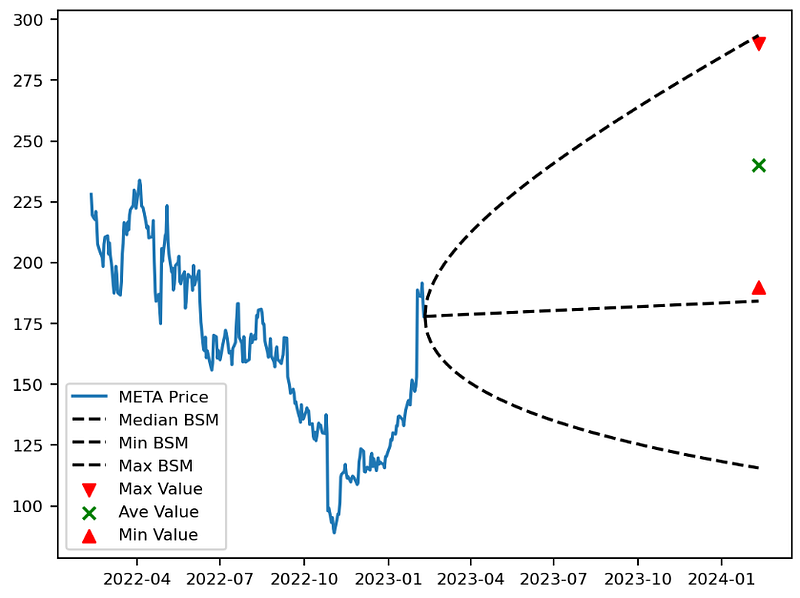
Now that we know how to calculate the implied volatility over time, we need to be able to calculate the price distribution at each point in time. The median of the distribution will be the current price grown at the risk-free rate into the future. To get a sense of what price range the market is saying is most likely we can grab the prices that imply +/- one standard deviation (14%->86%) given our median price, implied volatility, and a lognormal distribution. To do this we calculate the lognormal cumulative density function (CDF) from 0 to 3 times the stock’s current price.
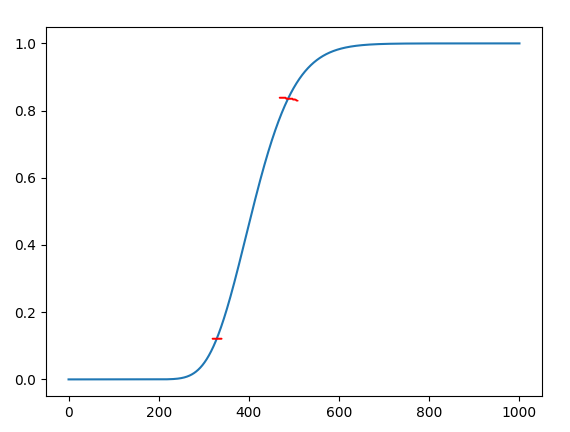
I calculated the CDF in one cent steps and then ran through it to find the prices at the two probabilities we care about.
We then repeat this step for each day using the relevant IV point and it builds the log-normal BSM cone.
Grab Stock Prices
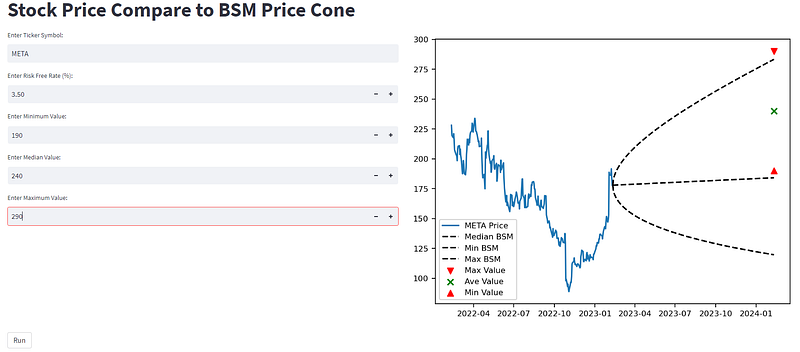
To get a sense of how the BSM’s forecast compares to historical prices, I also grab 1 year’s worth of stock price data.
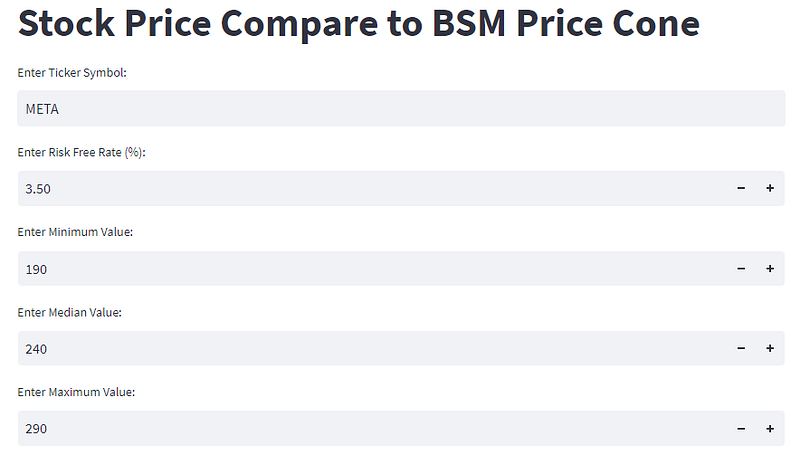
Application Interface
The interface lets you enter the ticker symbol, and it then automates all the BSM cone steps from above. The only other manual input is the risk-free rate. I have it default to the current (time of writing this article) 10-year US treasury bill yield. I also added three boxes for a valuation range estimate of the company. This is the most critical part of the application because it lets you compare your valuation of the company against the market’s prediction for price.
Conclusion:
Hopefully, by the end of the article, you have a better appreciation for the BSM, and more importantly, how we can use it to get a sense of the market’s estimate for future prices. Here is the link to the source code for the Streamlit app on GitHub. All in it was only 100 lines of code.
If you enjoyed this article, feel free to “applaud”, and you can follow me on Medium or sign up for emails to be notified of more stories like this:
Note that this article does not provide personal investment advice and I am not a qualified licensed investment advisor. All information found here is for entertainment or educational purposes only and should not be construed as personal investment advice.
Subscribe to DDIntel Here.
Visit our website here: https://www.datadriveninvestor.com
Join our network here: https://datadriveninvestor.com/collaborate


