
Be Careful When Using Pandas Groupby with Categorical Data Type
To avoid unexpected results

In statistics, a categorical variable is a variable that can take on one of a limited, and usually fixed, number of possible values. Pandas has a dedicated data type for categorical variables, which is category.
In some cases, it is highly useful and efficient to use the category data type. For instance, if you have a string or object column that consists of only a few different values, converting it to category data type will save a substantial amount of memory.
To compare the memory usage, let’s first create a Pandas Series that contains 3 million rows of 3 different strings with string data type.
import pandas as pdnames = pd.Series(["John", "Jane", "James"] * 1000000, dtype="string")names.memory_usage()
# output
24000128It takes up a space of approximately 24 million bytes. Let’s try it with the category data type.
names = pd.Series(["John", "Jane", "James"] * 1000000, dtype="category")names.memory_usage()
# output
3000260The memory usage is down to 3 million which is about 8 times smaller than the one with string data type.
The category data type allows for enforcing a certain set of possible values for a column. If you try to assign a value that is not in the specified categories, it raises a type error. Thus, all the values in a column with category data type are either in the given categories or a missing value (i.e. np.nan or None).
Back to our discussion of the groupby function on columns with category data type, there is an important point you should be aware of.
Let’s create a sample DataFrame with two columns, one being of category data type with 3 categories.
df = pd.DataFrame({
    "col1": pd.Categorical(
        ["A", "A", "B", "A", "B"],
        categories=["A","B","C"],
        ordered=False
    ),
    "col2": [10, 14, 20, 25, 23]
})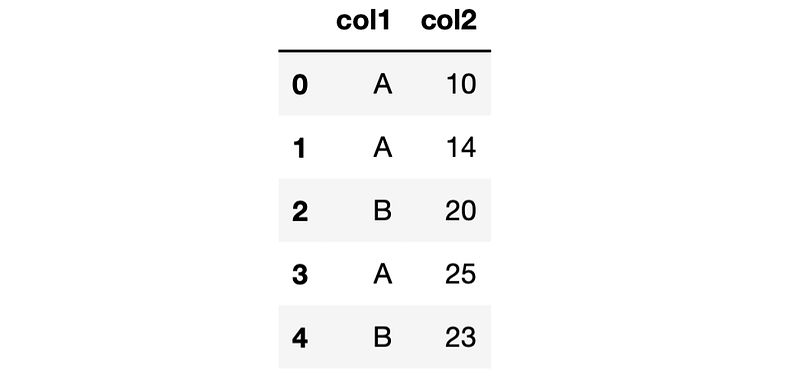
The data type of the column col1 is category with values A, B, or C.
df["col1"]
# output
0    A
1    A
2    B
3    A
4    B
Name: col1, dtype: category
Categories (3, object): ['A', 'B', 'C']
When we use the groupby function on this column, the category C appears in the result although the DataFrame does not contain a row with a C in the col1 column.
df.groupby("col1")["col2"].sum()
# output
col1
A    49
B    43
C     0
Name: col2, dtype: int64
We can change this behavior by setting the value of the observed parameter as True, which returns only the values that are observed in the DataFrame.
df.groupby("col1", observed=True)["col2"].sum()
# output
col1
A    49
B    43
Name: col2, dtype: int64
Tricky part
The trick part is when we have missing values in a column with category data type. Let’s add a new row with a missing value in the category column.
import numpy as npdf.loc[5,:] = [np.nan, 30]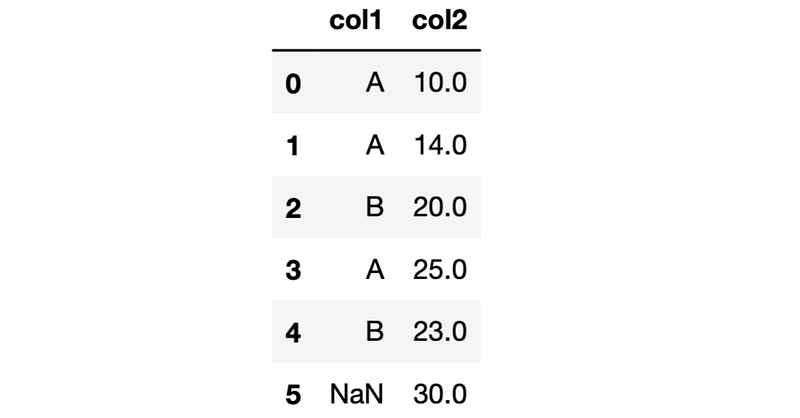
The groupby function does not show the aggregated values for missing values by default. Thus, if we group the rows by the col1 column, we will not see a group of NaN in the results. We can change this setting by using the dropna parameter and set its value as False. In other data types, this change will include the NaN group in the results. However, it does not work on the category data type.
Let’s do some examples to make it clear.
df.groupby("col1", dropna=False)["col2"].sum()
# output
col1
A    49.0
B    43.0
C     0.0
Name: col2, dtype: float64
Even if we use the observed parameter, the result will be the same. It will only remove the unobserved categories but the missing value will not be shown in the output.
df.groupby("col1", observed=True, dropna=False)["col2"].sum()
# output
col1
A    49.0
B    43.0
Name: col2, dtype: float64
This is an issue for the category data type only and is mentioned in the new release documentation. If the data type is string or object, the dropna parameter works as expected. Let’s confirm by changing the data type to string.
df["col1"] = df["col1"].astype("string")
df.groupby("col1", dropna=False)["col2"].sum()
# output
col1
A       49.0
B       43.0
<NA>    30.0
Name: col2, dtype: float64
We now see the missing values as a group in the output.
This may not be a significant issue but is definitely something we need to keep in mind. We frequently encounter missing values in raw data and should take them into account. Otherwise, we may end up having unexpected results or unreliable models.
You can become a Medium member to unlock full access to my writing, plus the rest of Medium. If you already are, don’t forget to subscribe if you’d like to get an email whenever I publish a new article.
Thank you for reading. Please let me know if you have any feedback.


