
Common Mistakes During A/B Testing
Our path to excellence is paved with mistakes. Let’s make them!
During the last couple of years, I have witnessed a lot of mistakes that people make during A/B testing design and post-analysis. I would like to discuss here three of such mistakes and how to overcome them.
Use Mann-Whitney for comparing medians
The first mistake is not an appropriate use of Mann-Whitney test.The method is massively misunderstood and misused, because most people use this test ,assuming that it is approximately non-parametric “t test” for medians. In reality, we can use Mann-whitney test only to check if there is a shift in our distribution.
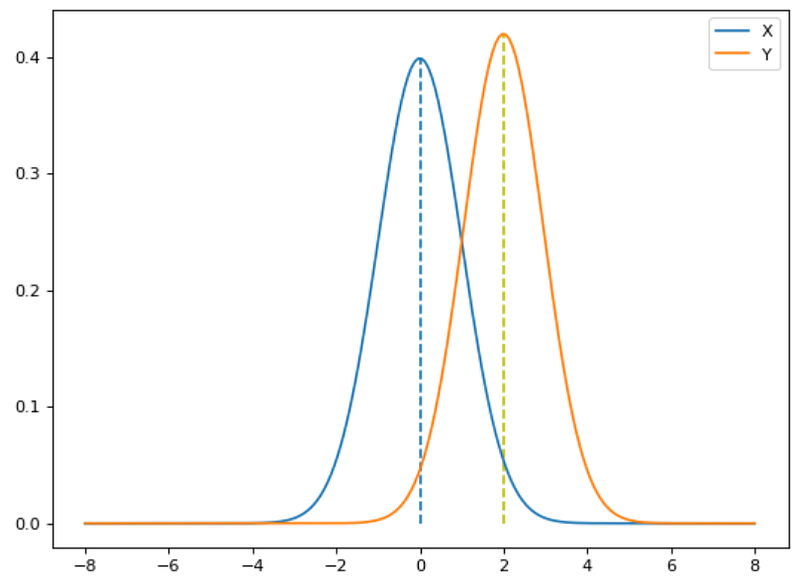
When we apply Mann-Whitney test, we set our hypotheses as following:
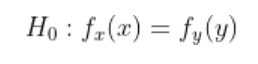
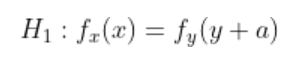
We should always take into account the assumptions, for this test there are just two:
- Our observations are i.i.d
- Our distributions have the same shape
How to calculate Mann-Whitney statistics :
- Arrange all the observations in order of magnitude
- Assign numeric ranks to all observations
- Calculate U statistics for both groups
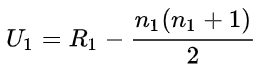
4. Choose the minimum from these two values
5. Use statistical tables for the Mann-Whitney U test to find the probability of observing this value of U or lower.
So we figured out that we can’t use it for comparing medians , what we should use instead?
Fortunately for us, the statistician Frank Wilcoxon developed in 1945 the signed rank test. Now it is officially called “The Wilcoxon Signed Rank Test”.
Our hypotheses for the test are as we expected at the beginning:
How to calculate The Wilcoxon Signed Rank Test statistics :
- For each pair of observations, compute the difference, and keep its absolute value and its sign
- Sort the absolute values from smallest to largest, and rank them accordingly.
- Finally , compute the test statistics:
4. W has a known distribution. If n is greater than about ,let’s say , 20, it’s approximately normally distributed. Therefore we can measure the probability of observing it under a null hypothesis and thereby obtain a significance level.
A bit of intuition behind the formula:
If the median difference is 0, then half the signs should be positive and half should be negative, and the signs shouldn’t be related to the ranks. If the median difference is nonzero , then W will be large.
Use bootstrapping for all cases and every dataset.
The second mistake is using bootstrapping all the time. I have seen so many times when people apply bootstrapping to every dataset without even a few preliminary actions in order to make sure that we can use bootstrapping at this case.
The prime assumption for applying bootstrapping is:
The sample should represent the population from which it was drawn
If our data sample is biased and don’t represent our population pretty good , our bootstrapping statistic will suffer as well and will be biased.That’s why we should measure proportions of different cohorts and segments.
If there are only women in our data sample , but in our whole customer database the genders are distributed equally , we can’t apply bootstrapping here.
The good practice is to compare all our main segments between our whole population and the dataset.
Always use the default values for type I and II errors.
The last , but not the least is choosing the right parameters for an experiment. In 95% of cases , 95% of data analysts / scientists , at 95% of companies the default values are used => 5 % for type I error rate and 20% for type II error rate (or 80% for power of test).
Why we just can’t choose 0% for type I error rate and 0% for type II error rate ?
It inevitably leads to an infinite amount of samples we have to collect and our experiment will last forever.
It’s definitely not what we are looking for.That’s why we have to compromise between number of samples we need to obtain and our error rates.
I foster people to take into account all possible specifications of your product. The most convenient way to do it , create the table ,that you see below, and discuss it with product managers and people who are responsible for the product.
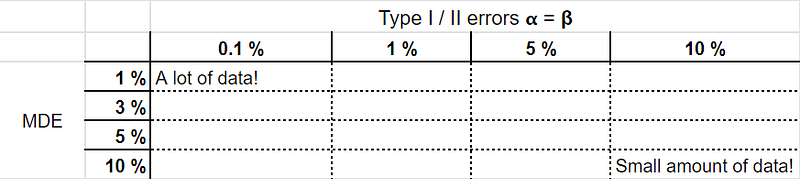
For Netflix even 1% MDE can lead to a significant profit , but for small startups it’s not the case. For Google it’s an absolute breeze to involve in an experiment event dozens of millions of people , therefore it’s better to set your type error rate as 0.1 % and to be more confident of your result.


