
Bayesian or Frequentist? What happens when we go to the races?
One topic that generally draws vocal commentary on social media or, at least, the kind of social media I read, is regarding what is the “right kind” of probability framework to use. Historically, there has been a “war” of sorts between the Bayesian interpretation of probability, as explained by Keynes and by Harold Jeffreys, and the Frequentist ideas codified by people like Egon Pearson and Jerzey Nyman.
I whole heartedly recommend that anybody who is interested in thinking about the meaning of statistical science read Jeffreys’ book. It is accessible, and thought provoking, although written before large scale computation permitted the use of Markov Chain Monte Carlo and so its practical methods are limited to approximations mostly revolving around the Normal distribution and the concepts of conjugate priors.
It seems that it’s very fashionable on the internet to heap scorn on Frequentist analysis and claim that Bayesian methods are the only “true” form of statistical science. From my perspective, as a practicing empirical scientist, frequentist methods are based on hypothesizing the outcome of repeated experiments that match the single one I’ve done, along the lines of:
If the data I see is driven by an unknown “true” parameter, how likely is it that its value lies within a given range based on my observations?
A Bayesian approach is to say:
Based on my observations, what is the likely distribution of the parameter I’m seeking to measure?
I’m sorry but, in the real world, I don’t really see much of a difference between these two statements. (p.s. I know the actual frequentist statement is not exactly what I’ve represented it to be.)
Basing statements upon hypothesized limiting case probability distributions, such as the Normal distribution, is fundamentally a bet that the methods you apply, although not “correct,” will work reasonably well. A Bayesian analysis based on an assumed prior distribution, whatever that is, convoluted through a likelihood function and converted into a posterior distribution, is also based on a modeling assumption that may not be correct but is, in fact, reasonable. The argument that Frequentist methods are based on a false premise is equally valid for Bayesian methods. The intellectual content of Fisher’s objection to Bayesian analysis, that science should deliver outcomes not based on the subjective input of the analyst, is one I find compelling.
Of course, in both cases, we have the Law of Large Numbers and the Central Limit Theorem, which are two consequences of the required mathematical properties of the things we call “random numbers,” hiding in the background helping us ultimately ignore the errors in our assumptions and get to the actual truth a scientist is seeking:
I don’t know exactly, but the value is going to be somewhere in this region…
On the Frequentist side: The Law of Large Numbers tells me that “averaging works” as an analytical method. It’s a particular example of the process of computing an estimate for a parameter that is some kind of aggregation of a sample of data and that will become an unbiased estimator of that parameter.
On the Bayesian side: The Central Limit Theorem is also a particular example of aggregation, but in this case it is observation the repeated convolution of probability distributions which, should they possess a finite mean and variance, will result in a distributional shape that gets ever closer to the Normal. In a larger picture, this leads to the concepts of Stable Distributions and “attractors” in the space of probabilty density functions.
Repeatability
As a physical scientist, my training and outlook is very firmly based on concepts of repeatability. Experiments are supposed to be repeatable if the theories they are based upon are true. And nobody is going to believe an experimental result that is not repeatable — we’ve have enough examples of scientific fraud, both in the past and recently, to make us go through the burdens of constructing repeatable experiments.
Unfortunately, experiments are “expensive” and so one of the goals of statistical science is to allow us to extract every last drop of value out of the data we measure. Formally that value is represented by what Fisher called sufficient statistics: the values computed from the data that tell you everything that you need to know about the data. If the data is Normally distributed, then the sufficient statistics are the population mean and the population variance. As a corollary, Fisher would tell us that if you say that the only statistics that matter are the mean and variance then you are saying that your data is Normally distributed. (And, as his ex-son-in-law George Box pointed out, “R.A.Fisher was ‘never’ wrong.”)
In most harsh interpretations of Frequentist and Bayesian methods there is no repeatability. Frequentists hypothesize an unknowable multiverse in which their experiments could be repeated. Bayesian's hypothesize a new kind of number, a degree of belief in what the value of a number that will ultimately be revealed to us just once will take.
I’m not that harsh: I’m a physical scientist by training and a social scientist by profession. I’m looking for repeatable results.
Horseracing
Horse racing provides a very interesting laboratory to investigate questions related to Market Efficiency and the Foundations of Statistics. One of the pioneers in this space is Bill Ziemba, or “Dr. Z.” as he is sometimes known, who I have been fortunate to work with on the second edition of my book Adventures in Financial Data Science.
At the race track there is a public market for wagers on which horses will win a race, or be placed, or various exotic bet combinations on multiple horses. For simplicity I will concentrate on win or place betting. Win betting pays off if the selected horse wins the race, and the punter loses their stake otherwise. Place betting, in the United States, is a bet for first or second place, and “show” betting is a bet for first, second or third. Generally, first, second and third are thought of as “winning” the race at some level.
The market for wagers may be one sided, with a bookmaker offering wagers and punters either taking or declining them — rather like a traditional market-maker in the stock market, or it may be an “exchange market” such as those sponsored by companies like BetFair in which all participants are the public. The opposite of placing a bet to win is offering such a bet, which is called “laying” as distinct from “backing” the horse.
The market price for the proposition “my horse will win” is adjusted into betting odds, which represents the payoff for the winning outcome. If I bet a sum, B, for a given horse to win with offered fractional odds, f, (which is betting odds of f:1), then the payoff to me is

For example: if the odds are 2:1 then I will make my twice my stake back if I win and lose it all if I lose.
If the horse has a true probability, p, of winning, and the only outcomes are win or lose, then my expected profit from the wager is

If these odds are fair, meaning that my expected payoff is zero, then it is elementary to see that these fair odds are given by

The Bayesian Interpretation
Let’s say I say that my personal probability for the outcome that my horse wins the race is p*. As a Bayesian, I am saying that the odds of the horse winning are f*:1, where

That is the horse is f* times more likely to lose than win. Clearly if f*>f then I think the horse is less likely to win than the bookmaker does, and I should lay the bet. If I think f*<f then I think the horse is more likely to win than the bookmaker does, and I should place the bet.
There is only one outcome: the horse either wins or loses, and I find out whether my Bayesian probability guided me well based on my bank balance after the race.
A Market for Probabilities
We can think of the betting crowd as a market for probabilities. If a bookmaker sees a lot of bets being placed they are going to realize pretty quickly that their estimate of the probability of the horse winning, p, is too low and they will respond by offering shorter odds (a smaller value of f). This reduces their losses in the event that the horse does win.
Similarly, if not enough people are betting then the odds are not long enough and the crowd doesn’t think that they will make money on the proposition. As a bookmaker does want betting to occur, they will lengthen the offered odds (increasing the value of f) to attract more volume into the market. This increases the number of people who are likely to make losing bets.
Thus the equilibrium price of the horse prior to the race starting should represent the aggregate view of the betting crowd and can be used to indicate the probability that the horse actually will win.
Note that, at all times, these were Bayesian personal probabilities which differ from punter to punter. The bookmaker doesn’t actually care which horse wins, they are just responding to supply and demand in a market. The odds they end up offering merely represent the market clearing value, which is essentially an average, of the personal probabilities of the people who backed or layed off the horse.
At the race track, everybody is a Bayesian.
The Frequentist Interpretation
The horse race only occurs once. After the race, the Bayesian personal probabilities are meaningless. Ex post, either the horse won or lost. The Frequentist interpretation requires that we run identical experiments in a hypothetical multiverse and says that the average value of the outcome (0 or 1 in this case) in this ensemble of hypothetical races is equal to the probability that the horse won in this one race. That’s also kind of meaningless as regards our individual race.
Lets Look at the Data
As I mentioned above, horse racing does provide a kind of special laboratory. Every day, globally, many of races are run for which the favourite has given odds, whether they are evens, 2:1, 3:1 etc. Although the horses, and tracks, and prizes, and jockeys all differ, the odds are the same: 2:1 means 2:1 whether the race occurs in New Jersey or Warwickshire or South Africa or Hong Kong. From a “Foundations of Statistics” point of view, the races are fungible. All of these differences vanish when we restrict the conversation to the odds, for those odds reflect all of the circumstances for any given race.
The multiverse does exist, and it’s on the racetrack.
What is the Rate at which a Horse with Given Odds Wins?
The online bookmaker BetFair (apparently no longer operating in the U.S. after the legalization of gambling — technically, the Supreme Court striking down Federal Laws that prohibited States from legalizing gambling) offered the ability to bet at a “BetFair starting price” or BSP, which was the odds offered for win or place betting at the start the race (“post time”) on any race it covered. Based on our market for probabilities above, this should represent the most accurate estimate of the aggregate odds of the betting crowd at the last time that bets were placable.
They also placed a lot of data online providing a huge database of race outcomes suitable for downloading and analysis. Which is what I did.
I have a database of some 3,651,342 race entries by horses in races from Aprile 2007 to May 2018. This lists the racetrack, race number, date, horse, final value of the BSP and the race outcomes.
- If the market is (close to) efficient;
- if the different races are truly equivalent; and,
- if the aggregate Bayesian personal probabilities map to the frequencies at which horses win races:
- then we should see that the observed rate of wins, r(f), is

This is indeed what we see.
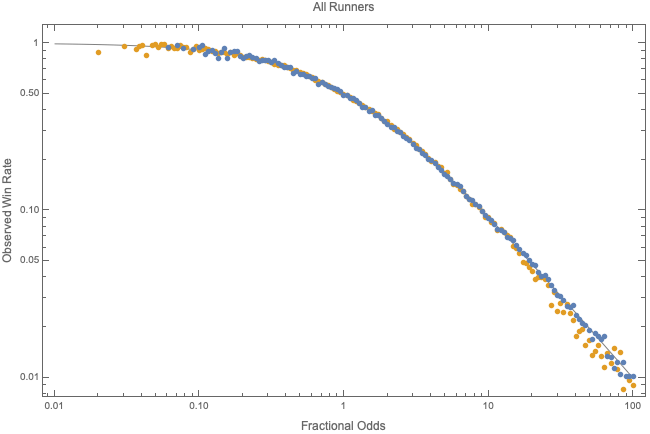
Since r(f) is the Frequentist unbiased and efficient estimator of p, the logical consequence of this is that p*=p.
Bayesian private probabilities agree with the probabilities inferred from a Frequentist analysis of horse races.
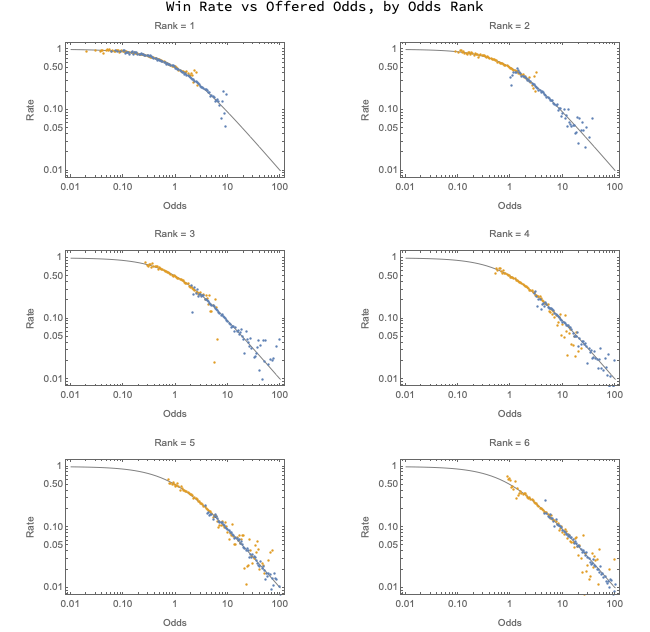
The prior chart is for all of the runners in the races reported by BetFair. However, we can drill down into the individual races by looking to see if the relationship becomes more or less accurate by odds rank (where 1=the favourite, 2=the next favourite, etc.).
Conclusions
For both Bayesian and Frequentist frameworks of analysis to be correct they must agree. If we were to find that one “worked” where the other failed then this would indicate the analyst should have a preference but, at least based on this data set, I find that:
- racetracks offer remarkably efficient markets; and,
- Bayesian and Frequentist analysis of race data offer supports the idea that the two methods are equivalent, like a “transform pair.”
Of course, this is not the whole story regarding horse races. There is evidence for biased expectations within the data and profitable bets to be made.
If you like this article and would like to read more of my work, consider my book Adventures in Financial Data Science which is available as an eBook for Kindle, and also from Apple Books and Google Books. A revised second edition will be published by World Scientific.
Alternatively, you can order the paperback directly from me via our website.
You can directly support my writing on Medium by subscribing through this affiliate link.