
Backtrader — Unleash the power of charts

In backtrader there exists a myriad of possibilities for configuring how we visualize the performance of our strategies, signals, and indicators on charts. This feature can be a bit intricate to grasp, so in this article, I will embark on a journey to elucidate some valuable tricks and best practices.
By default, if we abstain from explicit configurations, three fundamental aspects are visually represented:
- The fluctuation of our investment capital (top panel).
- The chronological operations/trades executed over time, depicted as red and blue dots in the middle panel.
- Buy and sell orders, annotated in the bottom panel alongside the price chart.
To exercise control over the presentation of this information, one can make use of the stdstats parameter when executing the brain. By default, this parameter is set to True, but can enable or disable it as per your preferences.
cerebro.run(stdstats=True)
cerebro.plot()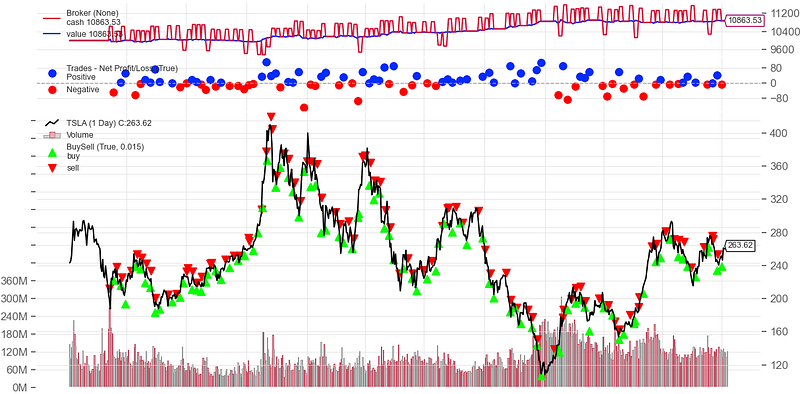
At the uppermost tier, you can observe the dynamic shifts in our invested capital. In the middle section, we witness the sequence of executed operations, while below, the purchase and sale orders.
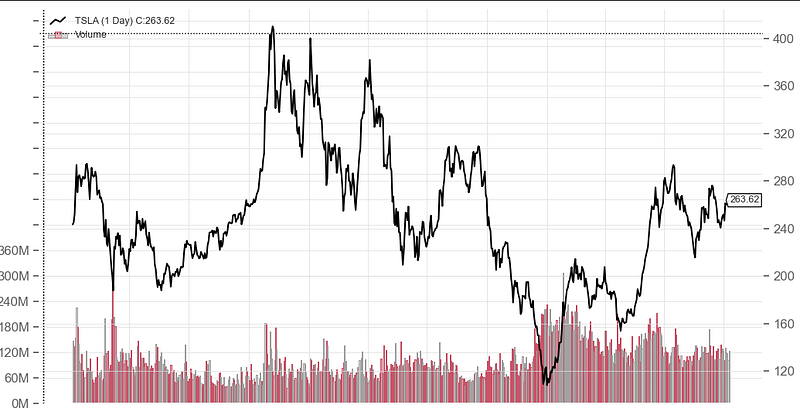
If we use stdstats=False, the resulting chart will exclusively show the price chart:
Similarly, we have the option to deactivate the display of volume data:
cerebro.plot(volume=False)Indicators
The indicators that we define within our strategies are also visualized on the chart:
def __init__(self):
    SMA_100 = bt.indicators.SimpleMovingAverage(self.data.close, period=100)
    ATR_20 = bt.indicators.ATR(self.data, period=20)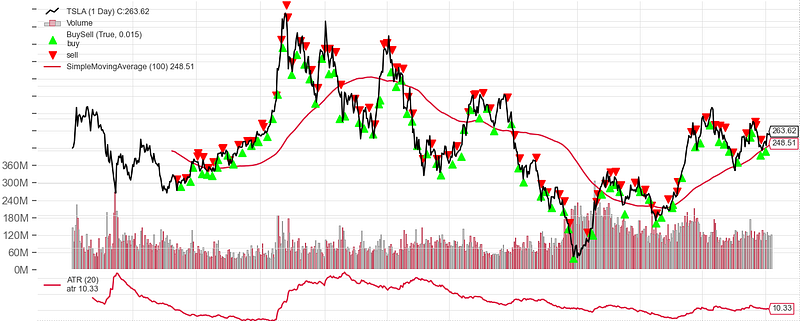
If we don’t want to show certain lines of an indicator (composite) the parameter plotlines can be used:
class MyIndicator(bt.Indicator):
    lines = ('line1', 'line2', 'line3',)
    plotlines = dict(line1=dict(_plotskip=True,), line2=dict(_plotskip=True,))
We can specify whether or not we want to show the indicator in the main plot (price) using plotinfo:
plotinfo = dict(subplot=False)Filter for the tickers we want to show
When employing a multi-data strategy (involving multiple symbols), we can specify which ones should not be included in the chart visualization by utilizing the plotinfo attribute and plotskip:
data = bt.feeds.PandasData(dataname=df)
data.plotinfo._plotskip = True
cerebro.adddata(data_0)
How to show indicators from an external DataFrame
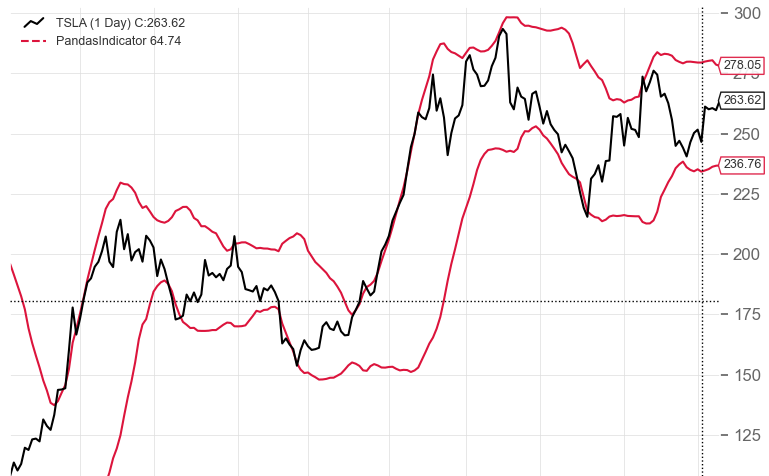
By default, only indicators defined within Backtrader strategies are automatically displayed on the chart. If the intention is to present additional columns imported from an external DataFrame, rather than using Backtrader indicators, it becomes necessary to create a custom indicator that leverages this external data. This indicator can then be added to the strategy.
For a practical illustration, let’s refer to the example provided in the article …
We create a dummy indicator that uses the preloaded data:
class PandasIndicator(Indicator):
    lines = ('stoch_k', 'stoch_d', 'bb_lower', 'bb_upper', 'forward_1d', )
    plotinfo = dict(subplot=False)
    plotlines = dict(stoch_k=dict(_name='% STOCH D', ls='--'),
                     stoch_d=dict(_name='% STOCK K', ls='-', _samecolor=True),
                     bb_lower=dict(_name='%BB LOW', ls='-', _samecolor=True),
                     bb_upper=dict(_name='%BB UP', ls='-', _samecolor=True)
                     )

    def __init__(self):
        self.l.stoch_k = self.data.stoch_k
        self.l.stoch_d = self.data.stoch_d
        self.l.bb_lower = self.data.bb_lower
        self.l.bb_upper = self.data.bb_upper
In the init method, we transform the data loaded via PandasData into the lines of the indicator.
Next, we specify the usage of this indicator within the strategy:
def __init__(self):
    PD = PandasIndicator()
Finally, the indicator will be displayed on the chart:
👏 Did you like the article? Give 1 to 50 applauses to show your support! Your applause motivates me to keep creating valuable content. Thank you for your support! 👏


