
Backtesting All Candlestick Patterns: Which is the Best?
There are more than 60 candlestick patterns out there but how profitable are they? How can we really use them in our trading?
Today, we are going to run a simple backtest on all the commonly known candlestick patterns and find out which performs the best. Let’s get to it.
1. Get financial data
For this analysis, we will use y_finance to download the historical price data of S&P 500 stocks from 2000 till now.
# get the full stock list of S&P 500
table=pd.read_html('https://en.wikipedia.org/wiki/List_of_S%26P_500_companies')
stock_list = table[0]['Symbol'].values.tolist()
for symbol in stock_list:
    df = yf.download(symbol, start='2000-01-01')
    if not df.empty:
        # save stock price data to local folder named 'price_data'
        df.to_csv(f'price_data/{symbol}.csv')
2. Candlestick Patterns Detection
Next, we are going to detect the candlestick patterns based on the price data. It will be a daunting task to code each pattern from scratch but fortunately, there are some public libraries we can use.
ta-lib
pandas_ta
Let’s take a look at a simple sample.
import talib
import pandas_ta as ta
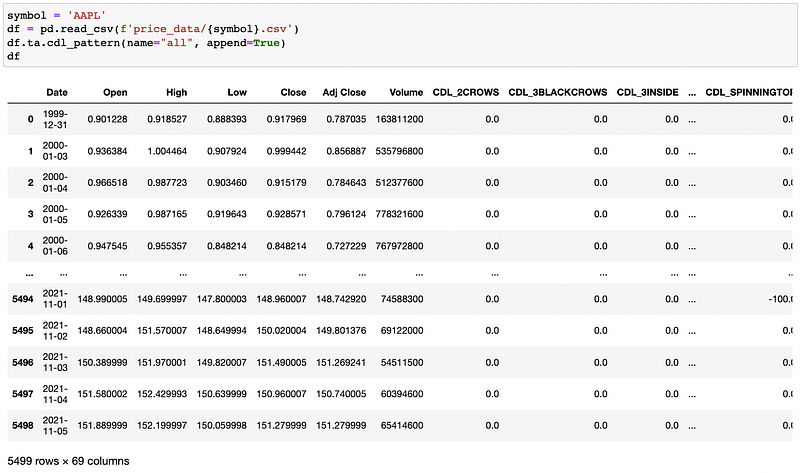
symbol = 'AAPL'
df = pd.read_csv(f'price_data/{symbol}.csv')
df.ta.cdl_pattern(name="all", append=True)Running the above code returns a DataFrame with each candlestick pattern as a column.
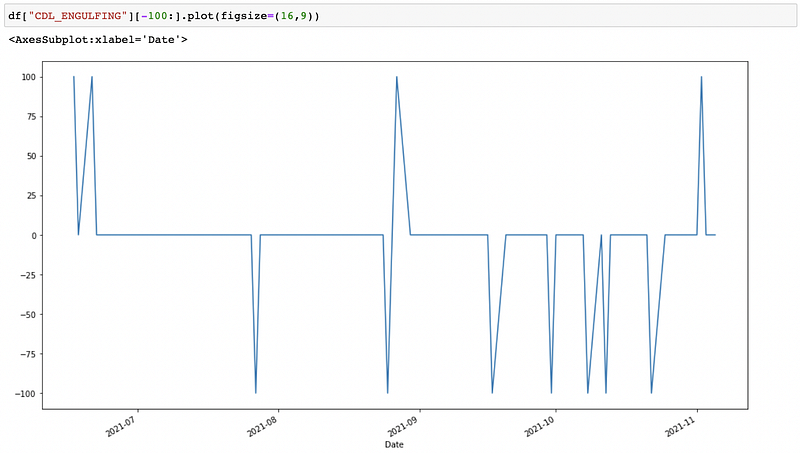
By plotting one of the columns, we can see that the value becomes 100 when a bullish pattern appears and becomes -100 when the counterpart bearish pattern appears.
3. Backtesting
Since not every candlestick pattern has a counterpart, to keep this analysis simple and consistent, we will only consider the bullish pattern and go long when a bullish pattern is found.
We will create a simple backtesting strategy to test the success rate of each pattern using a 2:1 risk/reward ratio:
- When a candlestick pattern is detected, enter the next day
- Sell when one of the following conditions is fulfilled:
- Stop loss (5% lower than buy price) is hit → unsuccessful trade
- Target price (10% higher than buy price) is hit → successful trade
You can find the complete code here.
4. Result
Out of 2,463,210 daily prices or candles, here’s what the result looks like, sorted by success rate.
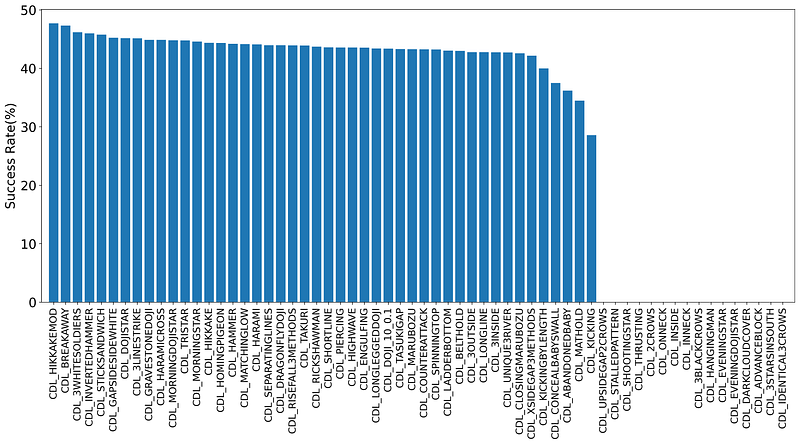
As you can see, the success rate is fairly low, the highest one being only 47.71%. Remember that success rate here means after a pattern is formed, the price goes on and hits the profit target. In other words, even after a bullish pattern is formed, the price has a slighly higher chance to go down and hit the stop loss than hitting the profit target.
You can get the full csv data here:
Conclusion
To be fair, candlesticks, on their own, do not have a lot of predictive value so this simple backtest analysis does not give the full context of trading candlestick patterns.
The analysis can be done more thoroughly and fairly by 1) considering bullish, bearish, reversal, and continuation patterns, 2) checking for confirmation candles, and 3) incorporating other technical analyses such as trend lines and volume analysis.
In future articles, I will try to give a more detailed introduction to trading candlestick patterns so stay tuned and subscribe if you haven’t!
Also, check out my other stories here related to financial analysis using Python.
I am actively learning and using my programming knowledge to enhance my trading. If you like what you see and are not subscribed to Medium yet, feel free to do so via the link below and follow me along my journey (part of the fee will go directly to me). Thanks for your support.
References
- https://patternswizard.com/technical-analysis/patterns/candlestick-patterns/
- https://www.elearnmarkets.com/blog/30-candlestick-patterns-in-stock-market/
- https://www.investopedia.com/articles/active-trading/062315/using-bullish-candlestick-patterns-buy-stocks.asp
Appendix
Here is a list of all the candlestick patterns supported by ta-lib:
CDL2CROWS            Two Crows
CDL3BLACKCROWS       Three Black Crows
CDL3INSIDE           Three Inside Up/Down
CDL3LINESTRIKE       Three-Line Strike
CDL3OUTSIDE          Three Outside Up/Down
CDL3STARSINSOUTH     Three Stars In The South
CDL3WHITESOLDIERS    Three Advancing White Soldiers
CDLABANDONEDBABY     Abandoned Baby
CDLADVANCEBLOCK      Advance Block
CDLBELTHOLD          Belt-hold
CDLBREAKAWAY         Breakaway
CDLCLOSINGMARUBOZU   Closing Marubozu
CDLCONCEALBABYSWALL  Concealing Baby Swallow
CDLCOUNTERATTACK     Counterattack
CDLDARKCLOUDCOVER    Dark Cloud Cover
CDLDOJI              Doji
CDLDOJISTAR          Doji Star
CDLDRAGONFLYDOJI     Dragonfly Doji
CDLENGULFING         Engulfing Pattern
CDLEVENINGDOJISTAR   Evening Doji Star
CDLEVENINGSTAR       Evening Star
CDLGAPSIDESIDEWHITE  Up/Down-gap side-by-side white lines
CDLGRAVESTONEDOJI    Gravestone Doji
CDLHAMMER            Hammer
CDLHANGINGMAN        Hanging Man
CDLHARAMI            Harami Pattern
CDLHARAMICROSS       Harami Cross Pattern
CDLHIGHWAVE          High-Wave Candle
CDLHIKKAKE           Hikkake Pattern
CDLHIKKAKEMOD        Modified Hikkake Pattern
CDLHOMINGPIGEON      Homing Pigeon
CDLIDENTICAL3CROWS   Identical Three Crows
CDLINNECK            In-Neck Pattern
CDLINVERTEDHAMMER    Inverted Hammer
CDLKICKING           Kicking
CDLKICKINGBYLENGTH   Kicking - bull/bear determined by the longer marubozu
CDLLADDERBOTTOM      Ladder Bottom
CDLLONGLEGGEDDOJI    Long Legged Doji
CDLLONGLINE          Long Line Candle
CDLMARUBOZU          Marubozu
CDLMATCHINGLOW       Matching Low
CDLMATHOLD           Mat Hold
CDLMORNINGDOJISTAR   Morning Doji Star
CDLMORNINGSTAR       Morning Star
CDLONNECK            On-Neck Pattern
CDLPIERCING          Piercing Pattern
CDLRICKSHAWMAN       Rickshaw Man
CDLRISEFALL3METHODS  Rising/Falling Three Methods
CDLSEPARATINGLINES   Separating Lines
CDLSHOOTINGSTAR      Shooting Star
CDLSHORTLINE         Short Line Candle
CDLSPINNINGTOP       Spinning Top
CDLSTALLEDPATTERN    Stalled Pattern
CDLSTICKSANDWICH     Stick Sandwich
CDLTAKURI            Takuri (Dragonfly Doji with very long lower shadow)
CDLTASUKIGAP         Tasuki Gap
CDLTHRUSTING         Thrusting Pattern
CDLTRISTAR           Tristar Pattern
CDLUNIQUE3RIVER      Unique 3 River
CDLUPSIDEGAP2CROWS   Upside Gap Two Crows
CDLXSIDEGAP3METHODS  Upside/Downside Gap Three Methods
Hi there — this is Todd Lincoln, Founder & Chief Editor of Investor’s Handbook. I get a lot of reader emails asking how to invest, so I thought I’d post my answer here.
There are two tools I recommend to all new investors:
#1) The Motley Fool is a stock recommendation service. Every month they share their top stock picks, along with a detailed research report. They recommended mega-winners Disney, Netflix, and Amazon over 10 years ago. I learned how to invest from their superb stock picks and education. Motley Fool offers a 30-day guarantee.
#2) TradingView is a charting tool. It’s an absolute must-have for deciding when to invest. I use it every single day and I never buy or sell anything without analyzing the chart first (for example, Apple). I’ve tried all the charting tools out there, and this is the best. Plus their community is overflowing with ideas. You can use TradingView 100% free.
Here’s what I recommend: Take stock picks from The Motley Fool and then research the best time to buy them using TradingView. That way you combine fundamental research (what to buy) with technical research (when to buy) to find the best stocks to buy now.
If you join either service, I may receive a commission for referring you.
Give Motley Fool and TradingView a try — I guarantee they’ll make you a better and more profitable investor.


