
Backtest your Trading Systems with Python — Plotting

This story is part of the Backtrader series. You can find the other stories here: Improve your Trading with Python. Also, there is a GitHub repo associated with this series, you can find it here if you want to follow the code in a clearer way: Backtrader Series.
When it comes to backtesting, plotting is a very important feature. Indeed, it’s important to have a visual representation of what’s happening with your strategy.
Today, I’ll explain how you can customize the charts Backtrader can generate for you.
How to Plot
I’ve already talked about it, but a quick reminder for you if you’ve forgotten.
To plot, you need first to backtest a strategy through cerebro.run() . And then you just have to call cerebro.plot() with the same Cerebro object.
cerebro.run()
cerebro.plot()
It will then display a beautiful chart!
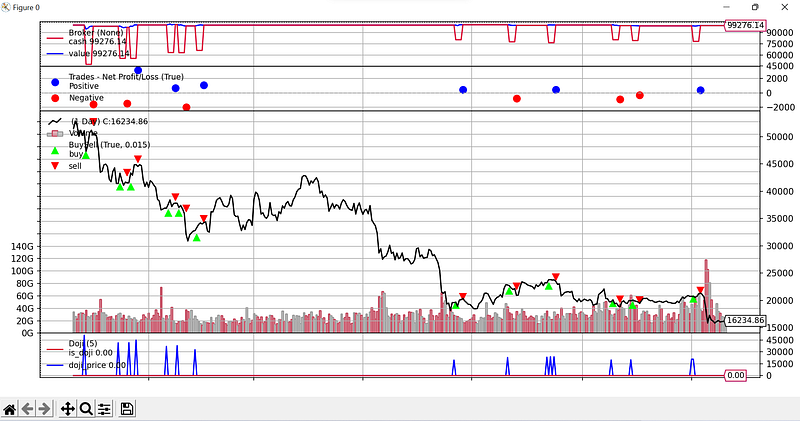
Observers
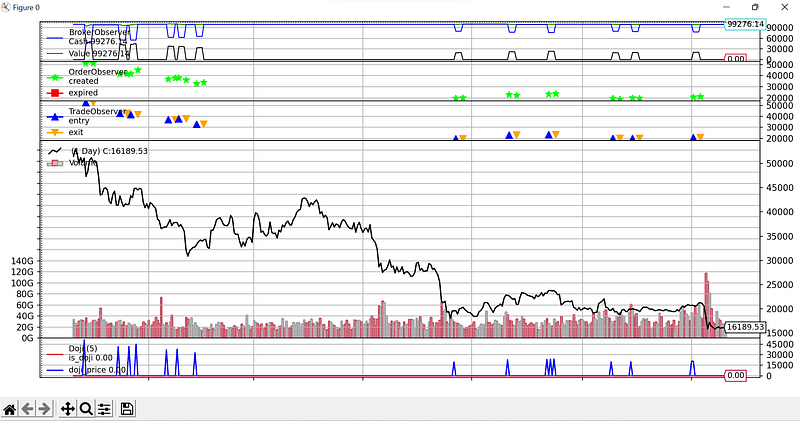
Observers are Backtrader objects used especially for plotting. When you call cerebro.plot() , by default, there are 3 Observers: BuySell, Trade, and CashValue.
You can see them in the picture above, at the top of the picture.
If you want to disable them, you have to pass in stdstats=False when you call cerebro.run()
cerebro.run(stdstats=False)
cerebro.plot()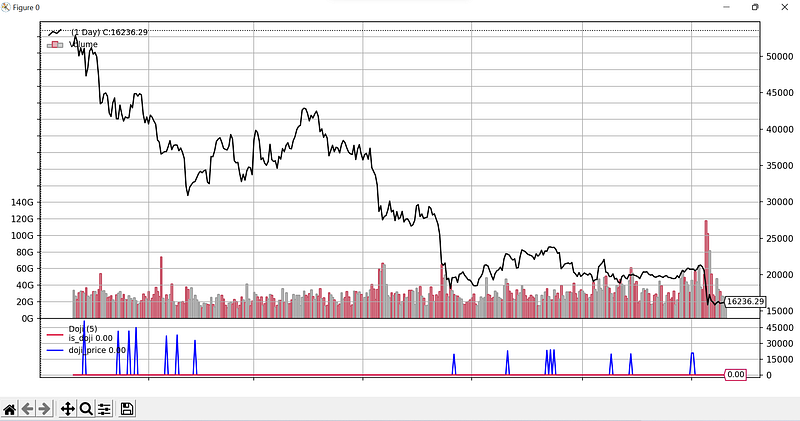
As you can see, there are not here anymore. There’s still something at the bottom of the chart, but I’ll talk about this later.
You can add Observers to a Cerebro using cerebro.addobserver(observer) .
By default, Backtrader provides some Cerebros, such as the 3 mentioned above, but also others like TimeReturn , LogReturns , Benchmark , etc… (full reference here).
Let’s add the TimeReturn observer to our chart:
cerebro.addobserver(bt.observers.TimeReturn)
crebro.run()
cerebro.plot()
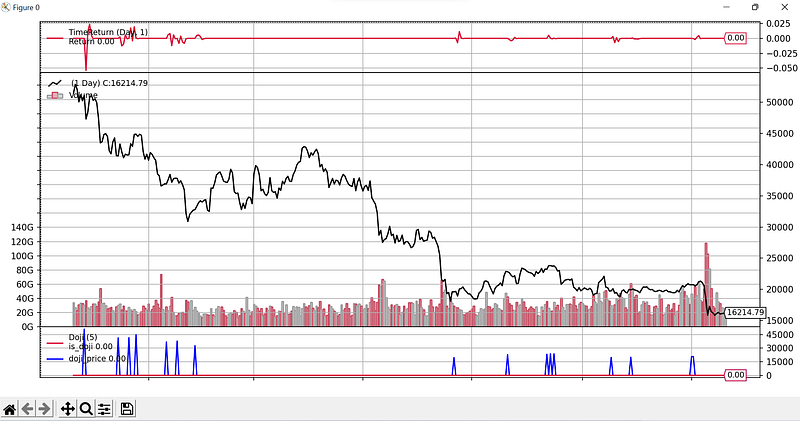
Here it is, at the top of the chart.
It’s also possible to develop custom observers, but I’ll talk about it after explaining plotlines .
Plotinfo/Plotlines
When developing Observers and Indicators, you can use attributes to specify what to plot, and how it should be plotted.
Let’s take an example to explain. We’ll develop an indicator representing the price, but with a delay. In the chart, it should look like this:
As you can see, it’s just the price, but with a delay.
Here is the code for the indicator:
Now, how to plot this indicator on our chart? Well, it’s already plotted. If we plot a strategy using this indicator, here is what we’ll see:
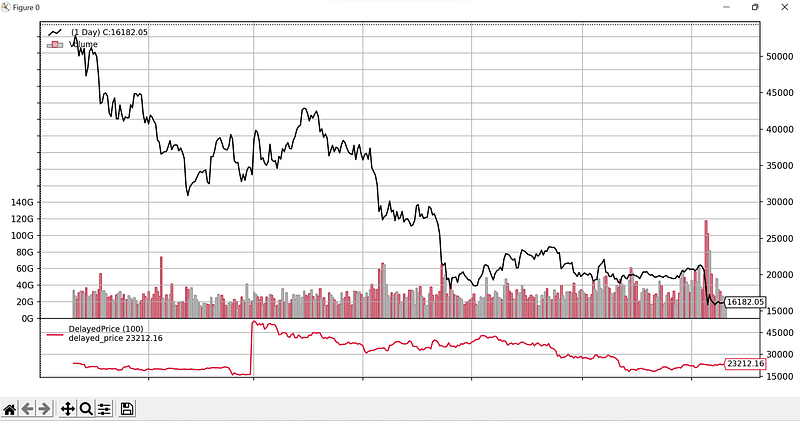
The indicator is plotted at the bottom of the chart. It’s not exactly what we want. That’s why we have to use plotinfo .
plotinfo can modify a lot of things. I won’t explain everything. The most important are:
plot: True or False to plot or not.plotnamesubplot: Whether it should be plotted in the main plot or in a subplot. For example, a moving average is useless if it’s plotted in a subplot, but the MACD is plotted in a subplot.plotyticks
For a full reference, check this.
Then, we can customize the options for each line independently. Remember what a line is? For the Bollinger Bands, the top, bot, and middle lines are 3 lines for example.
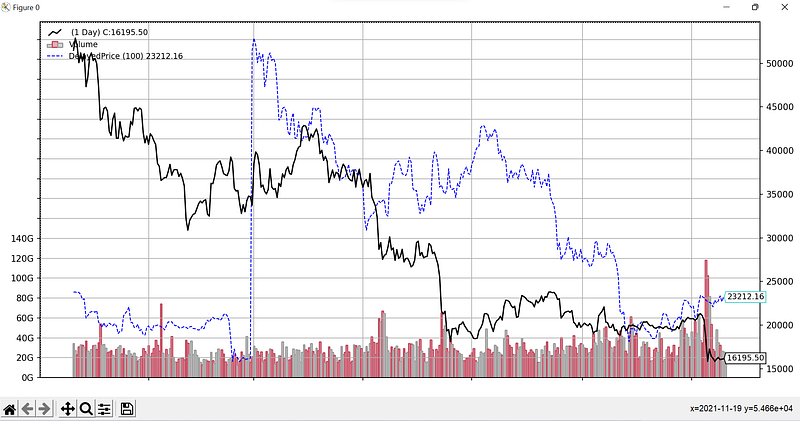
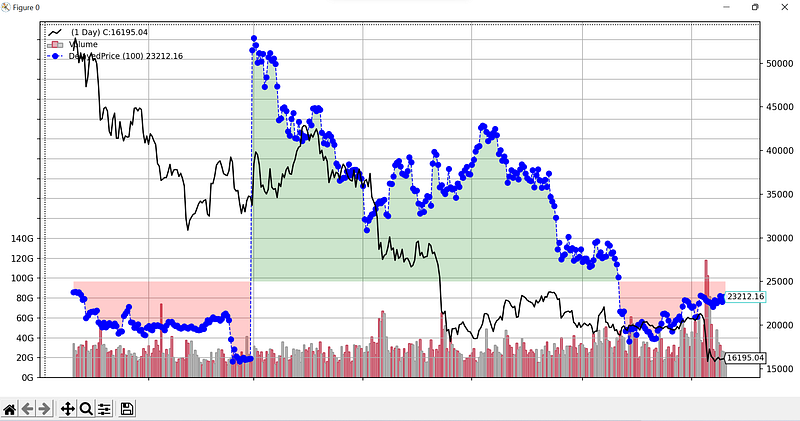
Our indicator only has one line, and want it to be blue and dashed.
So, we have to add this code to our indicator:
And now if we plot our indicator, it will look like in the picture above, in blue and dashed!
There are some more options you can use with plotlines :
marker: To plot the indicator as a marker._fill_gt: Fill with color when the value is greater than another line._fill_lt: The opposite.
For example, let’s modify a bit our code:
Here is the result:
Custom Observers
Now you know how to use plotinfo and plotlines , we can get back to developing custom observers.
Observers use the next method like all the other Backtrader objects. It means you implement them the same way you would do for analyzers or indicators.
Then, you can access strategy data using self._owner . Some of the most useful attributes within strategy are:
broker: info about current cash, starting cash, etc…_orderspending: info about orders._tradespending: info about trades.
I’ve developed 3 observers to show you how it works, so here is the code:
And here is how it looks on the chart:
Custom Scheme
You can customize how the whole chart should look. For example, here are some options you can modify:
cerebro.plot(
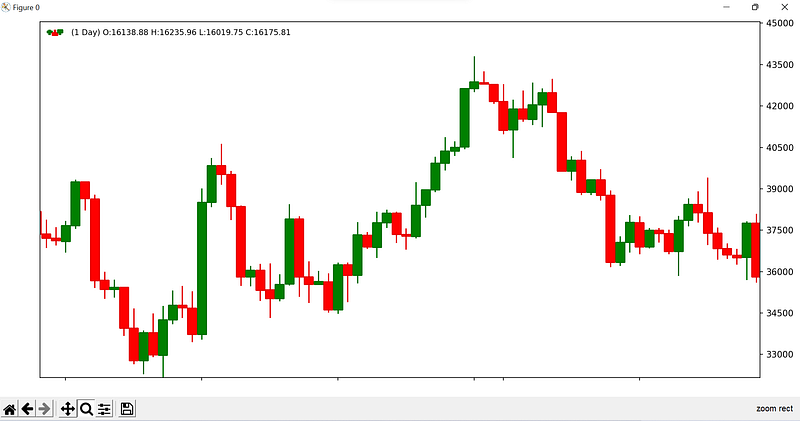
style='candlestick',
volume=False,
grid=False,
barup='green',
bardown='red'
)And here is how it will look:
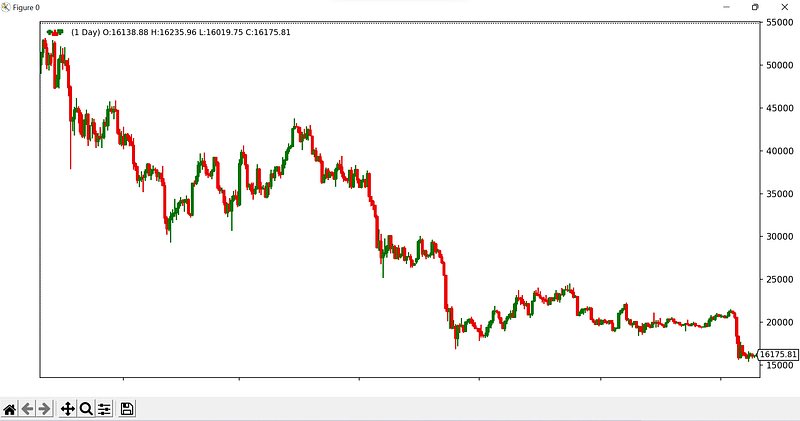
We can zoom in to see beautiful candlesticks!
Final Note
Now you know how to make beautiful charts. No more excuses to avoid backtesting so, as it now can be a funny thing when you see things poppin’ on charts!
To find the other stories of this series and more about mixing trading and Python, check this: Improve your Trading with Python
To explore more of my Python stories, click here!
If you liked the story, don’t forget to clap and maybe follow me if you want to explore more of my content :)
You can also subscribe to me via email to be notified every time I publish a new story, just click here!
If you’re not subscribed to Medium yet and wish to support me or get access to all my stories, you can use my link:
A Message from InsiderFinance

Thanks for being a part of our community! Before you go:
- 👏 Clap for the story and follow the author 👉
- 📰 View more content in the InsiderFinance Wire
- 📚 Take our FREE Masterclass
- 📈 Discover Powerful Trading Tools


