
Web Performance
Web Vitals: What Are They and How to Measure Them
Your guide to the essential performance metrics that Google uses to influence the rank of your web app
Jack is a young software engineer who loves his job. One morning as he was sitting on his desk resting his head on his fist, he came up with a brilliant idea of a new web application that could let him get his big break. He felt very enthusiastic and without wasting time, he started working on this project. Every day, for long hours, he sat at his computer and tapdanced his fingers across the keyboard. He implemented complex features, fixed tricky bugs, and cleaned up the code continuously to improve its quality.
He was also aware of how crucial the web performance is — slow web pages frustrate users and make them less likely to stick around though they wait for an app like Gmail which sometimes takes 6 seconds or longer to load. But his app is not Gmail, thus he should offer a better experience with much less load time.
He stayed up for nights, working on this issue and employed techniques like:
- deferring work with JavaScript,
- lazy-loading,
- async script loaders,
- client-side rendering,
- and dynamic content.
Months went by and Jack is very excited to go live after finishing the implementation. He started a connection with his FTP server and carried out a successful deployment.
A few weeks after deployment he received feedback from frustrated users who were unsatisfied with the app responsiveness. As they were trying to click on specific buttons, some late-loaded and -rendered content pushed important buttons down:
Google has punished Jack as well by ranking him down on the search result page.
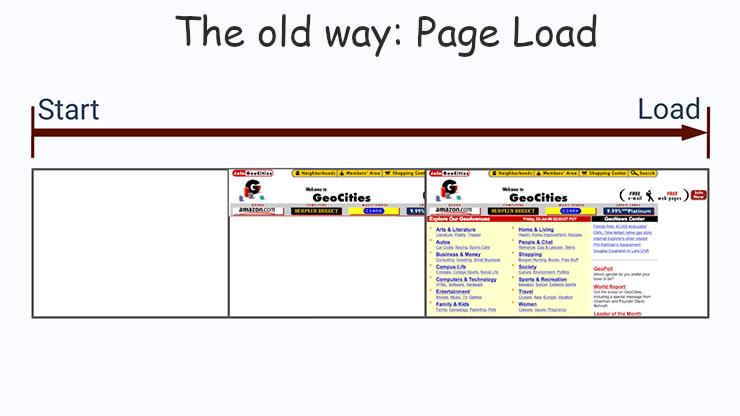
Jack is confused; his app has a really competitive PageLoad time he is proud of. But what he has missed is that PageLoad doesn’t fully capture whether a website feels fast. Worse, the techniques he has employed like lazy-loading, asynchronous content, and dynamic components often improve PageLoad time but create a slower experience from the end-user perspective.
This is a steep slope that could lead to a bad end. Jack is sad, and his heart is broken. But he wants to fix his app.
In the following section, we’re going to explain to him three essential performance metrics that he has ignored and show different techniques to measure and understand them so that he can produce a healthy application without the need to be a web performance expert.
If you want to build your web performance muscles, you can join us and learn with Jack.
Table of ContentsWhy PageLoad Time Is Not Enough?
The Core Web Vitals
∘ Largest Contentful Paint (LCP)
∘ Cumulative Layout Shift (CLS)
∘ First Input Delay (FID)
How to Gather These Metrics?
∘ Lab data
∘ Field data
Interpreting Performance Data
∘ The average
∘ Percentiles
Case Study: Edeka
Final ThoughtWhy PageLoad Time Is Not Enough?
Today, we can’t use one single metric to understand the performance anymore or make sure a webpage is fast because it could be slow in different ways:
- slow to start
- slow to finish
- slow to respond
- jumping around
- and more
If you open the Lighthouse tab in Chrome DevTools for any website, then click on the “Generate Report” button, you could see 6 metrics under the “Performance” section. These metrics are commonly used by popular performance tools.
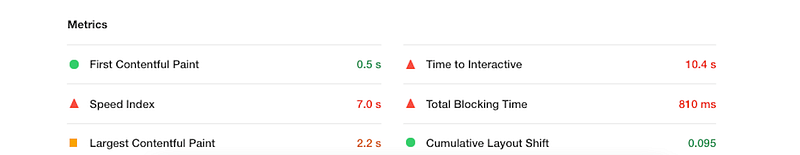
But to avoid getting lost with all the metrics that DevTools, Google Analytics, and other platforms offer, Google has introduced the Web Vitals which help developers focus on a few essential scores to deliver a great user experience.
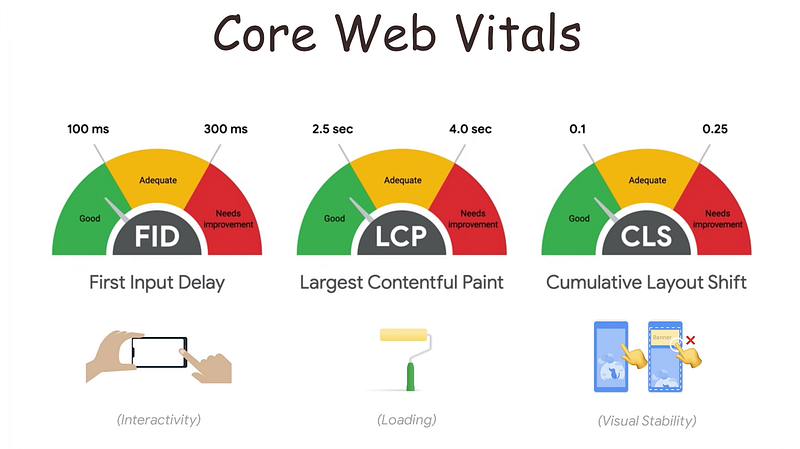
The Core Web Vitals
The Core Web Vitals describe the different ways a slow performance can impact a webpage. Google uses them as a search ranking factor.
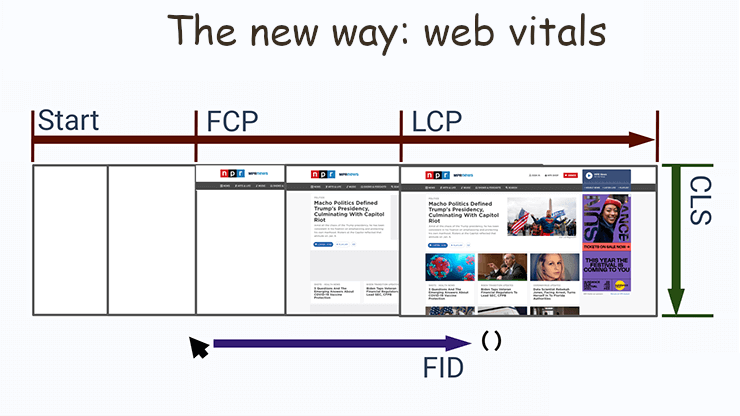
Largest Contentful Paint (LCP)
Some web pages look like they load fast, while all the meaningful content is still waiting to be loaded. A large content could be any element (text or image) that takes up a lot of space in your UI.
Largest Contentful Paint refers to how long the browser takes until it renders the largest amount of content to the screen so that the user can believe the page is useful.
Reasons for a poor LCP:
- Slow server response times
- Render-blocking JavaScript and CSS
- Slow resource load times
- Client-Side Rendering
Your LCP should be less than 2.5 seconds and not greater than 4.0 seconds.
Cumulative Layout Shift (CLS)
You may remember some web pages that kept shifting around, drawing new content, and pushing down the things you were trying to interact with. These web pages have lots of Layout shifts.
Layout Shift happens whenever new elements added to the page move the placement of other elements — like an advertisement rendering on top of a text you wanted to read or a button you wanted to click on. A lot of asynchronous content increments the number of layout shifts.
Cumulative Layout Shift (CLS) is the sum of all the layout shifts that happen on a page and affect the user experience. The following layout shifts do not count towards CLS:
- Layout shifts after these user inputs: clicks & taps, keypresses, viewport resizing.
- Layout shifts that occur within 500ms of user input.
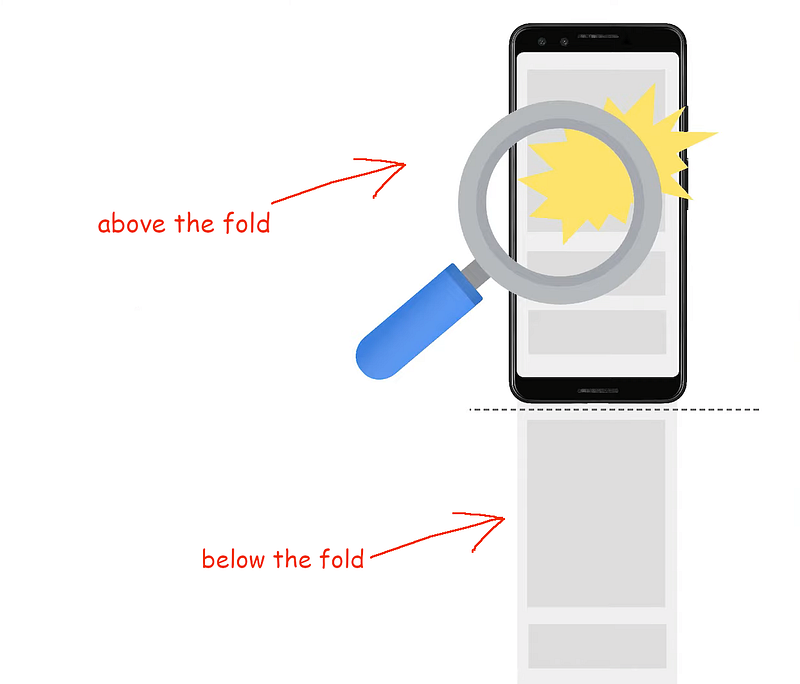
- Nonvisible layout shifts that are below the fold.
Reasons for a poor CLS:
- Images without dimensions
- Ads, embeds, iFrames without dimensions
- Dynamically injected content
- Web fonts causing FOIT/FOUT
To improve your CLS, you need to:
- Avoid moving content around once the user sees it and minimize the amount of late-rendered content.
- Reserve enough space for your dynamic content like ads or promos.
- Insert new content above existing content, just in case it’s a response to user interaction.
Your CLS score should be less than 0.1 seconds and no worse than 0.25 seconds.
First Input Delay (FID)
If your web page loads a huge amount of JavaScript, tracking pixels, and asset dependencies, you have to remember that each of these assets has to be downloaded, parsed, compiled, executed, and painted. If the browser is busy doing this work when the user first tries to use your page, there will be a delay until it can handle the user input or trigger a click event.
First Input Delay (FID) measures this delay — how long the page is busy when the user tries to interact with the page for the first time. This metric does not refer to an event handler code, it’s rather the time the browser delays handling the event because it’s busy.
Developers often solve this problem by showing a spinner (a loading screen) until the content is ready, but this approach delays the first input rather than solving the problem of loading a lot of stuff.
Reasons for a poor FID:
- Long tasks
- Long JavaScript execution time
- Large JavaScript bundles
- Render-blocking JavaScript
Your FID should be less than 100 ms and no worse than 300 ms.
How to Gather These Metrics?
There are different ways to measure web performance and they return different results and solve different problems. But they use two main techniques: Synthetic Monitoring and Real-User Monitoring.
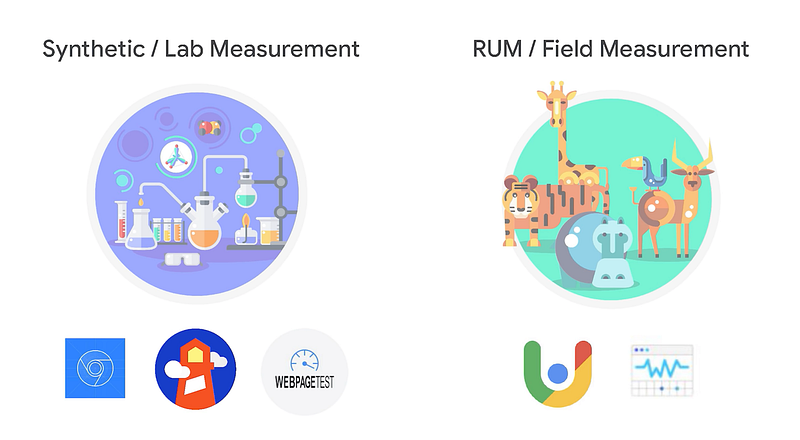
Synthetic Monitoring
Synthetic monitoring is an approach that emulates a real user interacting with your website from a specified location on the network. The data gathered with this method is called lab data because it measures performance from a known device connected to the network and not the actual performance of any user. It’s an estimation of what performance will be.
Synthetic monitoring helps to find and fix problems before they impact your end-users and helps as well to monitor complex transactions and business processes.
A synthetic test can be performed with tools like:
- Lighthouse — available on Chrome DevTools.
- WebPageTest
Real User Monitoring
Real User Monitoring (RUM) cuts through the guesswork by describing the actual performance experienced by end-users from a running website. It captures and analyzes every transaction of every user. The data gathered with this method is called field data.
RUM makes it easy to pinpoint where problems are occurring. It can reveal scenarios like:
- A user who made it halfway through a checkout process then clicked away to another page.
- Unexpected behavior that would otherwise be nearly impossible to predict and test for ahead of time.
RUM tools include:
- Google Search Console
- CrUX: Chrome User Experience⁵
You can also measure and log your real core web vitals using the web-vitals library available on GitHub. Here is a simple example of how to use it:
Interpreting Performance Data
Because field data includes data for each website user, there is a sheer volume of data generated that not all of it is relevant. To understand this result, you’ll get to use statistics.
The average
Calculating the average is an easy way to understand sets of data. But averages can be misleading because of the unusual performance distribution. If six users, for example, have experienced a performance of 99, 97, 95, 65, 63, and 60, the average would be 80, which is a good percentage while in reality, the site had performed poorly for half of its users.
Percentiles
In performance measurement, we often use the performance metrics for “most users”, “typical users”, and “worst users”. Or, p50, p75, and p95 scores:
- p50 is the 50th Percentile because 50% of your users have a faster experience and a better score. p50 is also known as median.
- p75 is the 75th Percentile.
- p90 is the 90th Percentile.
Case Study: Edeka
The following is an example of querying the Core Web Vitals stats (p75) from CrUX for the origin Edeka, a food supplier in Germany. The data will be returned for the period starting on January 1, 2020:
We can slice the results above even further, by making use of the device_summary table instead of the metrics_summary table, in order to see the percentage of users using a specific device (desktop or phone):
This is an extract from the results:
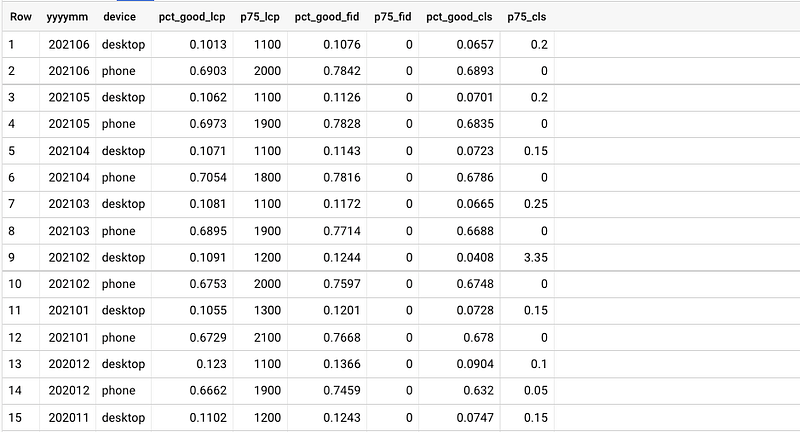
You can try by yourself mining the Chrome UX Report for insightful data using BigQuery for different origins, devices, and dates.
In the following video, I show how to measure the Web Vitals performance metrics for Edeka using 3 tools:
- Chrome DevTools (Lighthouse and Performance Timeline),
- WebPageTest,
- and BigQuery to get results from Chrome User experience Report (CrUX).
With DevTools and WebPageTest, I checked lab data, but with CrUX, I gathered metrics for real users (field data):
Final Thought
Just like many developers, you may have used or seen a number of tools to measure performance and found the abundance of both tools and metrics challenging to keep up with. The Core Web Vitals aim to simplify the landscape and help you focus on the metrics that matter most: Largest Contentful Paint (LCP), Cumulative Layout Shift (CLS), and First Input Delay (FID).
I hope with today's explanation it will be easier for you to wade through the different performance monitoring techniques and use the right solution for your case.
🧠💡 I write about engineering, technology, and leadership for a community of smart, curious people. Join my free email newsletter for exclusive access or sign up for Medium here.
References
¹ Optimize for Core Web Vitals
² Optimize for interactivity using Web Vitals (FID/TBT)
³ Measuring Web Performance in 2021
⁴ Fixing common Web Vitals issues


