
Average Living Expenses by Age. Are You Spending Wisely in Retirement?
How do you match up? Here’s how much seniors (and other age groups) earn and spend.

Will your money last through retirement? The answer to that question depends on how wisely you spend it.
Experts say that longevity risk — running out of money by outliving your savings — may be your biggest worry in retirement.
One way to mitigate the problem is to benchmark your spending habits against others. Unfortunately, most people clam up when you ask them about their finances.
But the United States government has everything we need. They can tell us average income, expenses, demographics, and even details like home ownership status.
Here’s an example, categorized into six age groups:
Your tax dollars at work
The United States Bureau of Labor and Statistics tracks and reports annual consumer spending. Their Consumer Expenditure (CE) Survey “provides data on expenditures, income, and demographic characteristics of consumers in the United States.”
In 2021 there were 133,595,000 households in the United States. They average 2.4 children, 1.3 people earning wages, and they spend $182 a year on sweets and $1,033 on fruits and vegetables.
The amount of data the bureau has captured on U.S. households is astonishing.
The data are presented in tables, databases, newsletters, and reports. They’re cross-tabulated and normalized, with standard errors and coefficients of variants.
The bureau surveys a subset of households and extrapolates it to the full population. They break it down by years, multi-years, and half-years chopped up into quintiles and deciles if you like.
Most importantly they break it down by age, which means we can look at data such as income and expenditures for the age categories they’ve chosen.
You can find the raw data [here].
First, what does “average” mean?
In math class, we learned that there are three “average” measures we can use with a data set: Mean, Median, and Mode. Each has its own strengths and weaknesses and different measures are appropriate for different types of data.
All averages calculated by the Bureau of Labor and Statistics use the mean (also known as the arithmetic average)
The mean is a sum of all answers divided by the count of answers. It’s a good measure for most expenditures, but not the best for income. The amount of money individuals spend on eggs or t-shirts won’t vary a lot, but mean income can be skewed to the high side by billionaire households.
My personal opinion is that expenditures are represented well enough by using the mean, but I’d recommend care when interpreting numbers associated with income.
These surveys are the only federal source of detailed consumer expenditures and demographics captured directly from respondents. Therefore, whether we like it or not, we must accept that the “average” referenced here is the mean.
Expenditures and other data
The information presented in this article is based on 2021 data that was published by the Bureau of Labor and Statistics in January of 2023.
Looking at the age group 65 and older:
- Households contain an average of 1.7 people.
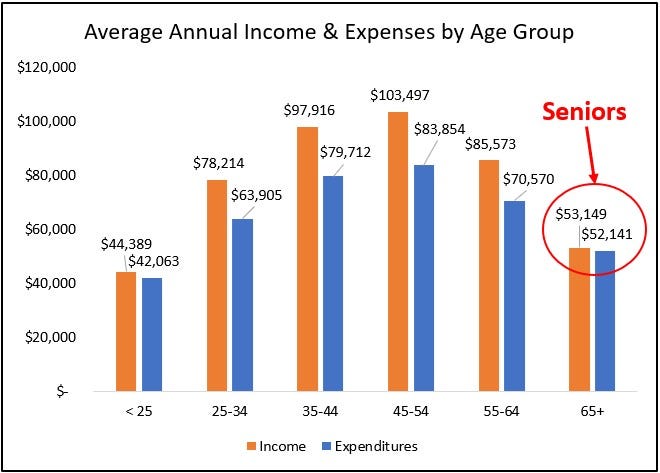
- Average household expenditures are $52,141
- Average household income is $53,149 after tax.
- The average age of survey respondents is 74.1 years old.
- 54% are women, and 46% are men.
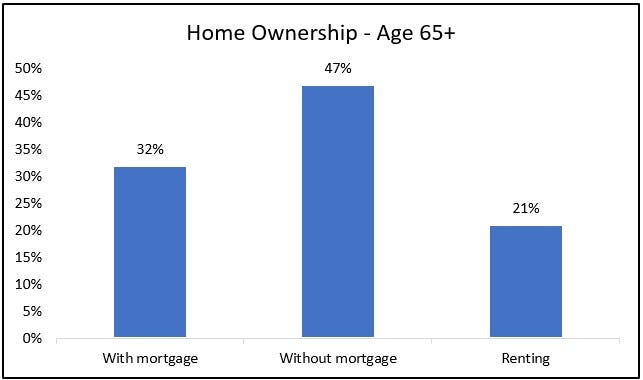
- One-third of households have a mortgage and pay a median of $1,824 a month for all housing costs (Mortgage, utilities, property taxes, maintenance, and insurance):
Senior expenses and demographics
We’ll use the age category of “65+” to represent seniors. Most seniors are retired, so consider it a good (but not perfect) model of expenses for retirees.
Average monthly expenses for seniors are broken out in the chart below. The bureau summarizes data in the categories shown but offers deeper insights if one digs further into the data (which we’ll do below).
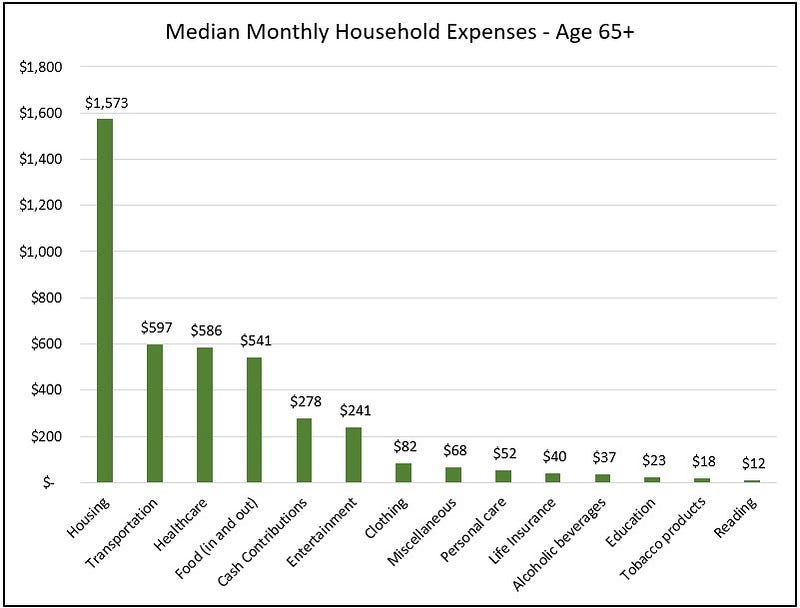
Remember these are averages and are influenced by extreme values. Housing expenses, for example, will be slightly reduced due to the fact that some people pay $0 for their mortgages.
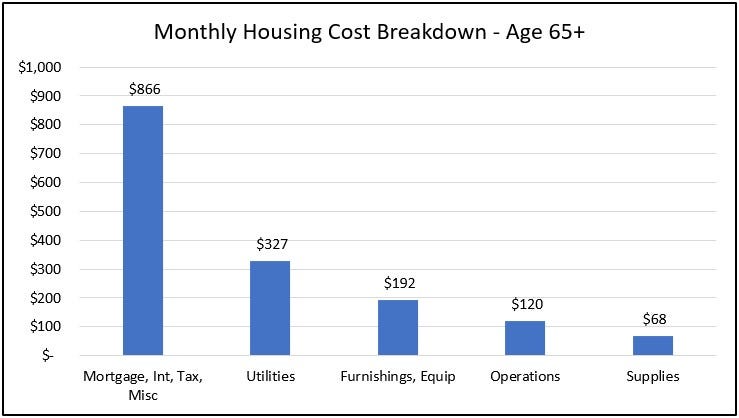
Housing
Housing is clearly the biggest expense. Here is a deeper look at housing costs by breaking them out into smaller components:
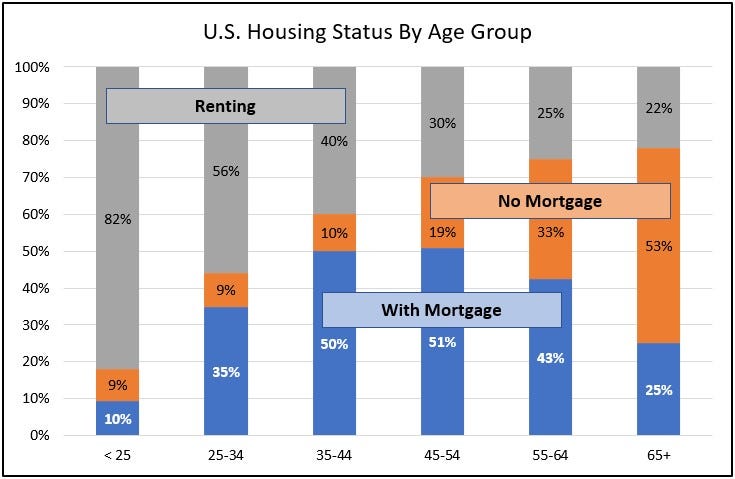
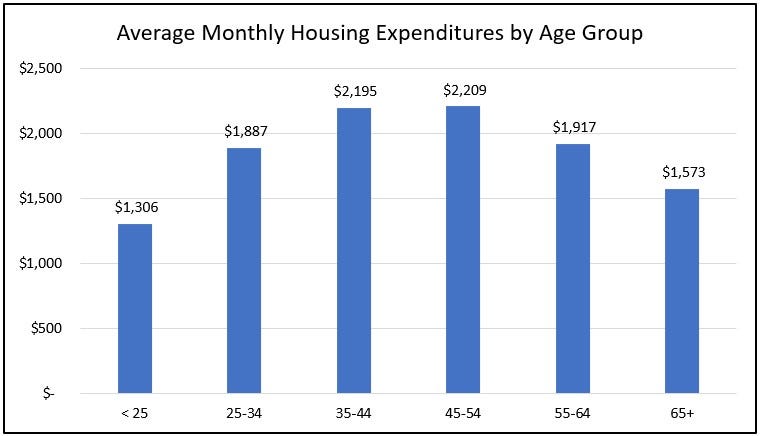
It’s also interesting to look at how expenses change as we age. The following chart shows housing expenses across all age categories. Younger and older groups have fewer mortgages which result in lower average costs.
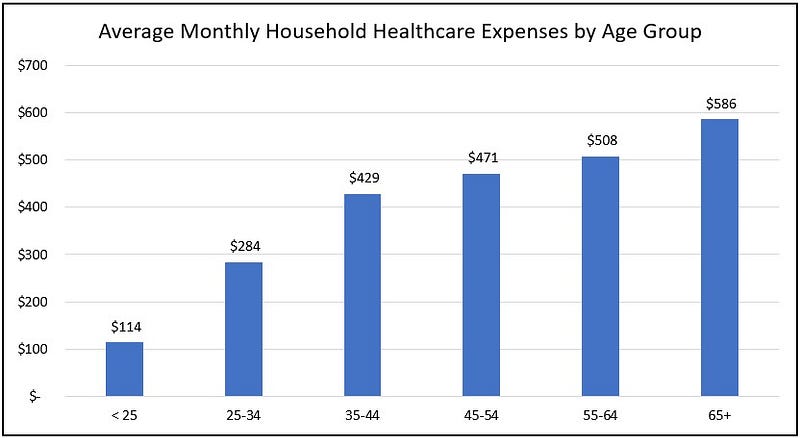
Healthcare
Healthcare is another large expense. It rises significantly as we age — more than a 500% increase from the lowest to the highest age group.
Since these are household figures, and the 65+ age group averages 1.7 people per household, we can estimate the per-person monthly cost for seniors is about $344.
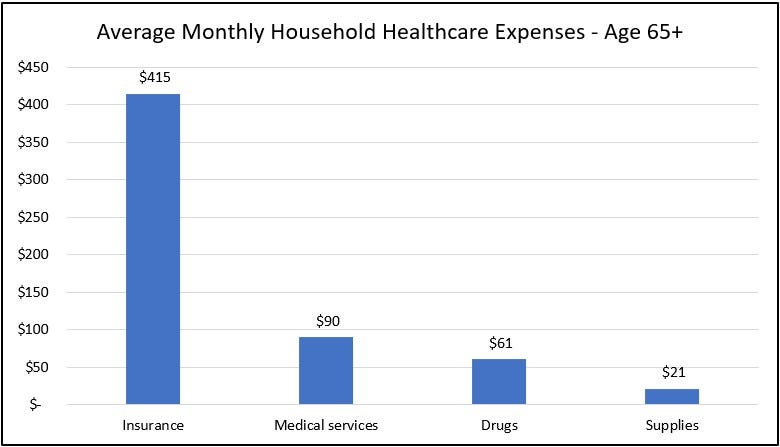
Looking deeper into the senior age category, we see that insurance costs constitute the bulk of our monthly healthcare expenses.
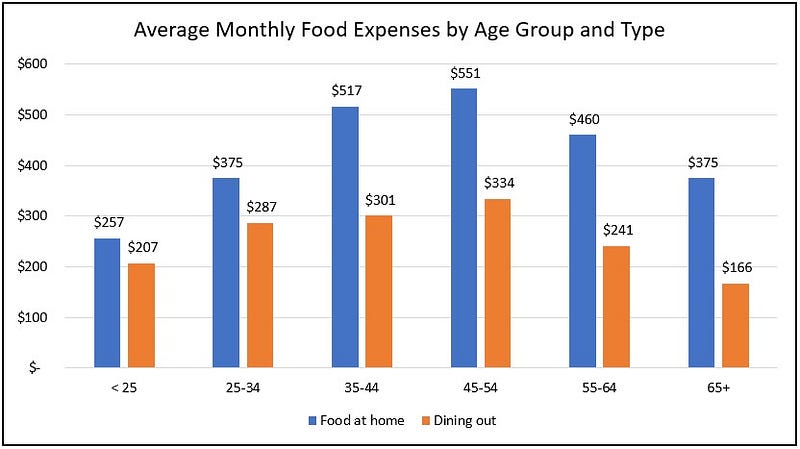
Food
Dining out is expensive, and since retirees tend to be on a fixed income it makes sense to see a decline.
Interesting findings
Combing the data, I uncovered some additional interesting data points.
Pets
People spend about the same amount on their pets in all age groups, about $800 a year.
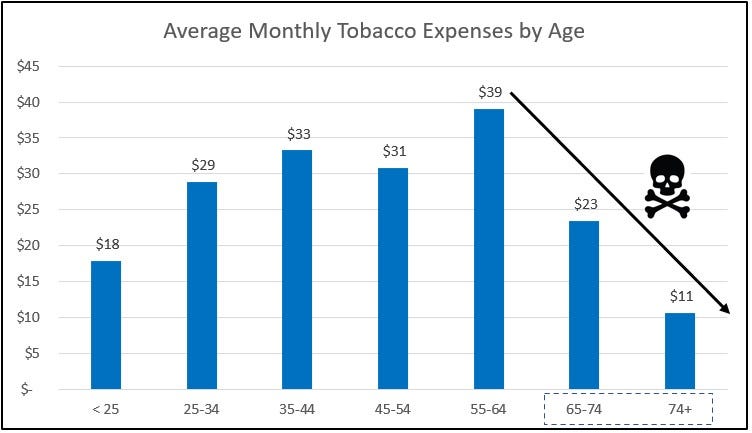
Tobacco products
This chart shows a huge drop in tobacco expenses late in life. It’s possible that people quit as they age, but also likely that smokers died from the unfortunate habit. Note that in this chart I’ve expanded the 65+ category to emphasize the drop.
Cell phone expenses
Senior households spend $68 a month on cell phone service. Since there are 1.7 individuals in an average household, that’s $40 apiece.
Eggs
Everyone is screaming about the cost of eggs right now. Turns out in 2021, the average household spent $6 a month on eggs. Across all age groups, it varied from $4.50 to $7.00.
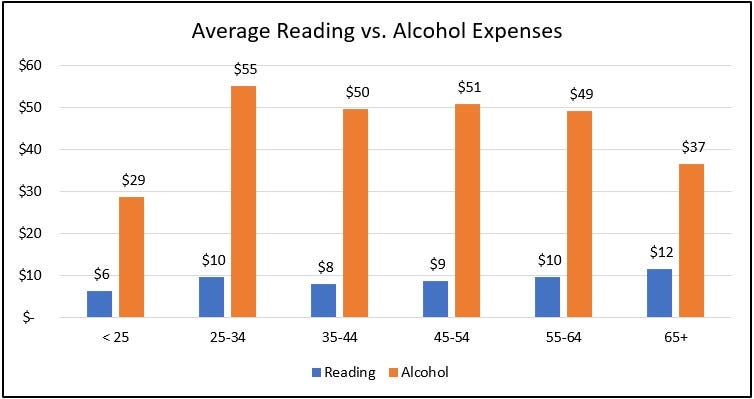
Reading vs Alcohol
I’ll leave you with one final chart that illustrates the futility of mankind.
Conclusion
It goes without saying (although I’ll say it anyway) that each of us is unique and our circumstances will often differ from the averages. Still, it’s interesting and helpful to benchmark ourselves against others and their experiences.
I hope you found this helpful.
Spend wisely and enjoy your retirement.
If you’re considering joining Medium please sign up below to help support me and other independent writers. $5 a month is all it takes. Thanks!
Connect with me here on Medium and at brianfeutz.com. You can contact me directly at [email protected].
Here’s another story I think you’ll like: