
Autoscaling apps on Kubernetes with the Horizontal Pod Autoscaler
This article gives a high-level overview of how the Horizontal Pod Autoscaler (HPA) in Kubernetes works and how to use it.
A previous version of this article has been published on learnk8s.io.
Contents
- Introduction
- Different types of autoscaling in Kubernetes
- What is the Horizontal Pod Autoscaler?
- How is the Horizontal Pod Autoscaler configured?
- How are application metrics obtained?
- Putting everything together
Introduction
Deploying a stateless app with a statically configured number of replicas is not optimal.
Traffic patterns can change quickly, and the app should be able to adapt to them:
- When the rate of requests increases, the app should scale up (i.e. increase the number of replicas) to stay responsive.
- When the rate of requests decreases, the app should scale down (i.e. decrease the number of replicas) to avoid wasting resources.
In the context of horizontal scaling, scaling up is also called “scaling out”, and scaling down is also called “scaling in”. This contrasts with vertical scaling (see below), which uses only the terms “scaling up” and “scaling down”.
With the Horizontal Pod Autoscaler (HPA), Kubernetes provides excellent support for autoscaling applications in the way just described above.
Different types of autoscaling in Kubernetes
First of all, to eliminate any misconceptions, let’s clarify the use of the term “autoscaling” in Kubernetes.
Kubernetes includes several autoscaling features:
- Horizontal Pod Autoscaler (HPA): adjusts the number of replica Pods of an application (horizontal scaling)
- Vertical Pod Autoscaler (VPA): adjusts the resource requests and limits of the containers of an application (vertical scaling)
- Cluster Autoscaler: adjusts the number of nodes of the cluster
These autoscalers are completely independent of each other and they all use different concepts and mechanisms.
This article focuses exclusively on the Horizontal Pod Autoscaler.
What is the Horizontal Pod Autoscaler?
The Horizontal Pod Autoscaler (HPA) is a built-in Kubernetes feature that allows to horizontally scale applications based on one or more default or user-defined metrics.
Horizontal scaling means increasing and decreasing the number of replicas. Vertical scaling means increasing and decreasing the compute resources of a single replica.
Technically, the HPA is a Kubernetes controller that tracks and is configured by HorizontalPodAutoscaler resources.
The HPA continuously monitors one or more metrics about an app and adjusts the number of replicas of this app to keep the metrics as close as possible to a specified target value.
The HPA can scale all those Kubernetes resources with a
scalesub-resource, which include the Deployment, StatefulSet, and ReplicaSet.
Here’s how the control loop executed by the HPA looks like:
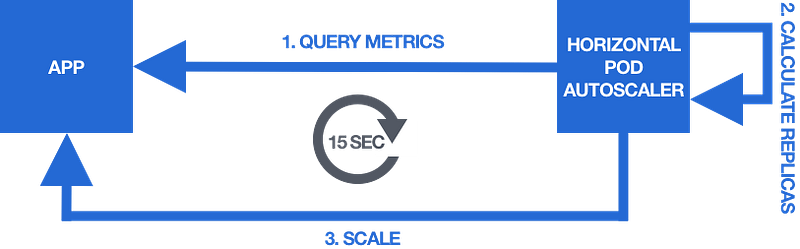
The steps of the control loop are:
- Query the scaling metrics
- Calculate the desired number of replicas
- Scale the app to the desired number of replicas
By default, this control loop is executed every 15 seconds.
The calculation of the desired number of replicas is based on the scaling metrics and a user-provided target value for these metrics.
On each iteration of the control loop, the HPA calculates a replica count that brings the measured values of the metrics as close as possible to the target values.
For example, imagine that the scaling metric is the average number of received requests per second (req/sec) across all the replica Pods of the app:
- If the target value is 10 req/sec and the current value is 20 req/sec, the app is overloaded, and the HPA has to scale up the app (i.e. increase the number of replicas) to make the metric decrease and get closer to the target value.
- If the target value is 10 req/sec and the current value is 2 req/sec, the app is underutilised, and the HPA has to scale down the app (i.e. decrease the number of replicas) to make the metric increase and get closer to the target value.
The algorithm for calculating the desired number of replicas is based on the following formula:
X = N * (c/t)Where:
Xis the desired number of replicasNis the current number of replicascis the current value of the scaling metrictis the target value for the scaling metric
You can find the details about the HPA algorithm in the Kubernetes documentation.
That’s how the HPA works from a high level — now let’s look at how it is configured.
How is the Horizontal Pod Autoscaler configured?
Configuring the HPA is done through HorizontalPodAutoscaler resources.
A HorizontalPodAutoscaler resource allows you to specify the following pieces of information:
- The application to scale (e.g. a Deployment)
- The allowed minimum and maximum number of replicas
- The scaling metric
- The target value for the scaling metric
As soon as you create a HorizontalPodAutoscaler resource, the HPA kicks in and starts monitoring and autoscaling the app according to the parameters you provided.
Here’s an example HorizontalPodAutoscaler resource:
apiVersion: autoscaling/v2beta2
kind: HorizontalPodAutoscaler
metadata:
  name: myhpa
spec:
  scaleTargetRef:
    apiVersion: apps/v1
    kind: Deployment
    name: myapp
  minReplicas: 1
  maxReplicas: 10
  metrics:
    - type: Pods
      pods:
        metric:
          name: myapp_requests_per_second
        target:
          type: AverageValue
          averageValue: 50
There exist different versions of the HorizontalPodAutoscaler resource that differ in their manifest structure. The above example is version
v2beta2, which is the most recent one at the time of this writing.
The above example HorizontalPodAutoscaler resource includes the following pieces of information:
- The application to autoscale (scaling target) is a Deployment named
myapp - The minimum and maximum number of replicas are 1 and 10, respectively
- The scaling metric is called
myapp_requests_per_second - The target value for the scaling metric is 50
This means that the HPA will autoscale the myapp Deployment between 1 and 10 replicas by attempting to keep the average value of the myapp_requests_per_second metric of all the Pods of the app as close as possible to 50.
Now, there’s still one large missing piece in the puzzle.
What is the myapp_requests_per_second metric and where does it come from?
How are application metrics obtained?
How does the HPA obtain the metrics that are specified in the HorizontalPodAutoscaler resources?
It turns out that the HPA queries these metrics from the metrics APIs (and in turn any application metrics that are to be used for autoscaling must be exposed through the metrics APIs):
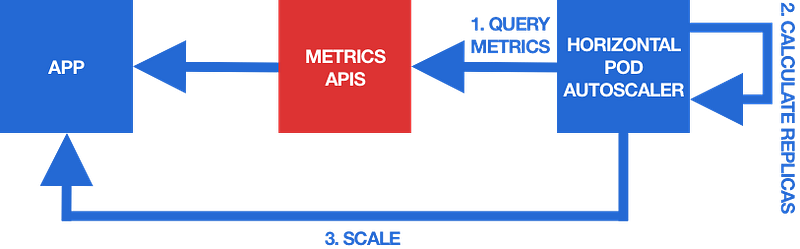
The metrics APIs are a central place in a Kubernetes cluster where different types of metrics can be exposed to different types of clients — and the HPA is one of these clients.
There exist three different metrics APIs that are intended to serve different types of metrics:
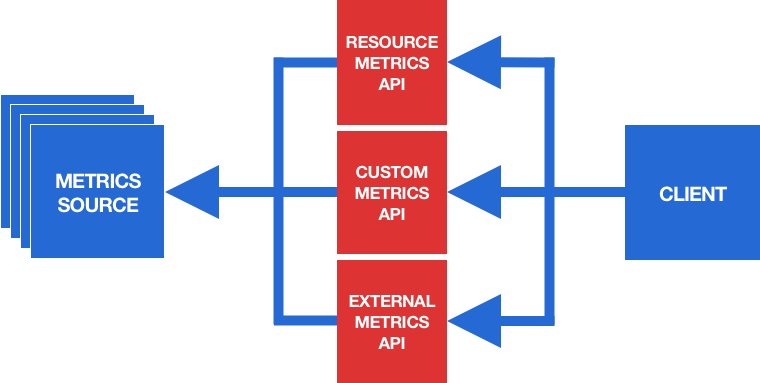
- The Resource Metrics API serves predefined resource usage metrics of Pods and nodes (currently, CPU and memory usage are supported).
- The Custom Metrics API serves user-specified custom metrics that are associated with Kubernetes objects in the cluster.
- The External Metrics API serves user-defined custom metrics that are not associated with any Kubernetes objects in the cluster (these may be metrics from services outside the cluster, such as cloud services).
From a technical point of view, the metrics APIs are Kubernetes extension APIs. That means, they are extensions to the Kubernetes core API that are accessible through the Kubernetes API server.
The endpoint paths for these metrics APIs on the API server are:
/apis/metrics.k8s.io/v1beta1/for the Resource Metrics API/apis/custom.metrics.k8s.io/v1beta1/for the Custom Metrics API/apis/external.metrics.k8s.io/v1beta1/for the External Metrics API
By default, the metrics APIs are not enabled in a Kubernetes cluster. They have to be explicitly enabled by installing appropriate extension API servers (see below).
The myapp_requests_per_second metric from the above example is a user-defined metric and it is associated with Pods (its meaning is the current number of requests per second that the Pod receives).
This means that the myapp_requests_per_second metric has to be served through the Custom Metrics API.
But how does this metric get into the Custom Metrics API?
The answer is that you have to arrange things for this metric being collected, processed, and served through the Custom Metrics API.
To do so, you have to enable the Custom Metrics API in the first place.
Enabling a metrics API is done by installing a metrics API server in the cluster that provides this specific metrics API:
- For the Resource Metrics API, there’s an official metrics API server called Metrics Server.
- For the Custom Metrics API and External Metrics API, there exist various third-party metrics API servers. One of the most popular ones is probably Prometheus Adapter.
Metrics APIs can be enabled independently of each other. For example, you can enable the Resource Metrics API without enabling the other two metrics APIs.
A metrics API server serves metrics trough a metrics API, but it usually does not collect the raw metric data from the metrics sources. This job is done by another component called a metrics collector (which may run inside or outside the cluster):
- For the Resource Metrics API, the default metrics collector is cAdvisor, which is compiled into the kubelet, and thus runs by default in every Kubernetes cluster. It collects resource usage metrics (such as CPU and memory) of all containers on a node and the node as a whole.
- For the Custom Metrics API and External Metrics API, various third-party metrics collectors can be used. The most popular one is probably Prometheus, but other general-purpose metrics collection systems, such as Datadog or Google Stackdriver, can also be used.
The metrics collector and metrics API server form an integrated “metrics pipeline” and they must be able to communicate with each other. Most metrics collection systems (such as Prometheus) have an associated metrics API server (such as Prometheus Adapter), and they should be used in conjunction with each other.
A typical setup with all three metrics APIs enabled thus looks as follows:
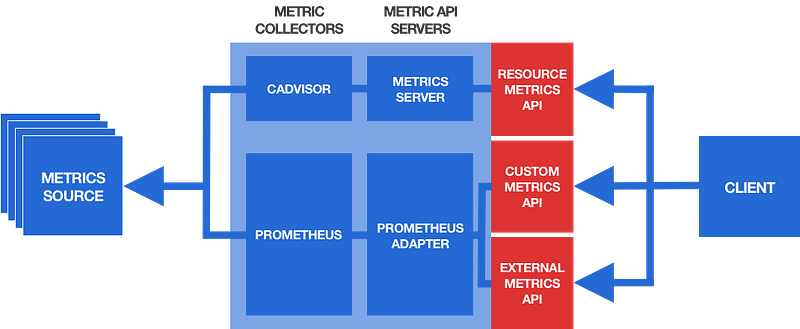
This setup uses a metrics pipeline consisting of cAdvisor and Metrics Server for the Resource Metrics API (the official defaults), and another metrics pipeline consisting of Prometheus and Prometheus Adapter for the Custom Metrics API and External Metrics API.
It’s important to note that in a vanilla Kubernetes cluster none of these components (with the exception of cAdvisor) are installed by default. If you want to make use of the metrics APIs (for example, for autoscaling apps with the HPA), you have to install and configure them appropriately.
Coming back to the myapp_requests_per_second metric, the situation in this example scenario would look as follows:
- Prometheus collects metric data from the Pods belonging to the
myappDeployment. - Prometheus Adapter obtains the collected metric data from Prometheus and serves it as a metric named
myapp_requests_per_secondthrough the Custom Metrics API. - The HPA queries the
myapp_requests_per_secondmetric from the Custom Metrics API and uses it to autoscale themyappDeployment.
How to configure a metrics collector (such as Prometheus) to collect a specific metric, and a metrics API server (such as Prometheus Adapter) to expose a specific metric is highly specific to the used metrics collector and metrics API server solutions. The details can be found in the corresponding documentations (for example, the documentations of Prometheus and Prometheus Adapter).
This was quite a mouthful, so let’s recapitulate by walking through an example.
Putting everything together
To better see how things work together, let’s walk through the concrete steps you have to do to autoscale an application with the HPA based on the average number of requests the app’s Pods receive per second.
The following assumes that the cluster has no metrics APIs enabled yet, the app to autoscale is a Deployment named myapp, the metric that you want to autoscale on is called myapp_requests_per_second, and that you want to use a Prometheus-based custom metrics pipeline (as shown above).
Here’s what you have to do:
- Instrument the app to collect raw metric data (such as the total number of received requests) and expose it in Prometheus format so that Prometheus can collect it. This is typically done by using a Prometheus client library.
- Install Prometheus in the cluster (theoretically, it may also run outside the cluster) and configure it to collect the metric data exposed by the app. Configuring Prometheus to collect a specific metric is done with a so-called Prometheus “scrape config” file.
- Install Prometheus Adapter in the cluster and configure it to regularly query the collected metric data from Prometheus, transform it into a metric named
myapp_requests_per_second, and expose it through the Custom Metrics API. Configuring the Prometheus Adapter is done with a Prometheus Adapter configuration file. - Create a HorizontalPodAutoscaler resource in the cluster that defines the Deployment named
myappto be autoscaled based on the metric namedmyapp_requests_per_second(exposed by the Custom Metrics API) and some target value (say, 50). You could reuse the HorizontalPodAutoscaler resource shown earlier in this article for this purpose.
That’s it — as soon as the HorizontalPodAutoscaler is created, the HPA will kick in and start monitoring the specified metric through the Custom Metrics API and autoscale your application appropriately.
And you can lean back and be confident that your app always adapts to the current demand.
Putting this knowledge into practice is still a lot of work. In particular, there are many idiosyncratic details of configuring Prometheus and Prometheus Adapter to collect and expose the right metrics in the right way.
If time allows, I will provide a complete practical step-by-step walkthrough of setting all this up in a future article.
Let me know in the comments if you would be interested in that!


