
Anomaly Detection: Identifying Outliers in Data
In data analysis, anomaly detection is the process of identifying data points that deviate significantly from the majority of the data. These data points are also known as outliers and can provide valuable insights into the data.
Outliers can be caused by a variety of reasons, such as data entry errors, equipment malfunctions, or natural variations in the data. It is important to identify these outliers and investigate the cause, as they can affect the accuracy and reliability of the analysis.
In this article, we will explore different techniques for identifying outliers in data.
1. Z-Score Method
The Z-Score method is a statistical technique for identifying outliers in data. It involves calculating the standard deviation of the data and then determining the number of standard deviations away from the mean each data point is. Data points that are more than a certain number of standard deviations away from the mean are considered outliers.
Let’s take a look at an example using the Z-Score method:
import numpy as np

# Generate some random data
data = np.random.normal(0, 1, 100)

# Calculate the Z-Score for each data point
z_scores = (data - np.mean(data)) / np.std(data)

# Define the threshold for outliers
threshold = 3

# Identify the outliers
outliers = np.where(np.abs(z_scores) > threshold)[0]

# Print the outliers
print('Outliers:', outliers)
#Output:
Outliers: [44]In this example, we generate 100 random data points from a normal distribution with a mean of 0 and a standard deviation of 1. We then calculate the Z-Score for each data point and define a threshold of 3. Any data point that is more than 3 standard deviations away from the mean is considered an outlier. The code then identifies the outliers and prints their indices.
2. Interquartile Range (IQR) Method
The Interquartile Range (IQR) method is another statistical technique for identifying outliers in data. It involves calculating the IQR, which is the range between the 75th percentile and the 25th percentile of the data. Data points that are more than a certain number of IQRs away from the median are considered outliers.
Let’s take a look at an example using the IQR method:
import numpy as np
from scipy import stats

# Generate some random data
data = np.random.normal(0, 1, 100)

# Calculate the IQR for the data
q1, q3 = np.percentile(data, [25, 75])
iqr = q3 - q1

# Define the threshold for outliers
threshold = 1.5

# Identify the outliers
outliers = np.where((data < q1 - threshold*iqr) | (data > q3 + threshold*iqr))[0]

# Print the outliers
print('Outliers:', outliers)
#Output:
Outliers: [51 56 75 95]In this example, we generate 100 random data points from a normal distribution with a mean of 0 and a standard deviation of 1. We then calculate the IQR for the data and define a threshold of 1.5. Any data point that is more than 1.5 IQRs away from the median is considered an outlier. The code then identifies the outliers and prints their indices.
3. Local Outlier Factor (LOF) Method
The Local Outlier Factor (LOF) method is a machine learning technique for identifying outliers in data. It involves calculating the density of each data point and comparing it to the density of its neighbors. Data points that have a much lower density than their neighbors are considered outliers.
Let’s take a look at an example using the LOF Method:
import numpy as np
from sklearn.neighbors import LocalOutlierFactor

# Generate some random data
data = np.random.normal(0, 1, (100, 2))

# Fit the LOF model to the data
model = LocalOutlierFactor(n_neighbors=20)
labels = model.fit_predict(data)

# Identify the outliers
outliers = np.where(labels == -1)[0]

# Plot the data and outliers
import matplotlib.pyplot as plt
plt.scatter(data[:, 0], data[:, 1], c=labels)
plt.scatter(data[outliers, 0], data[outliers, 1], marker='x', s=100, linewidths=2, c='r')
plt.show()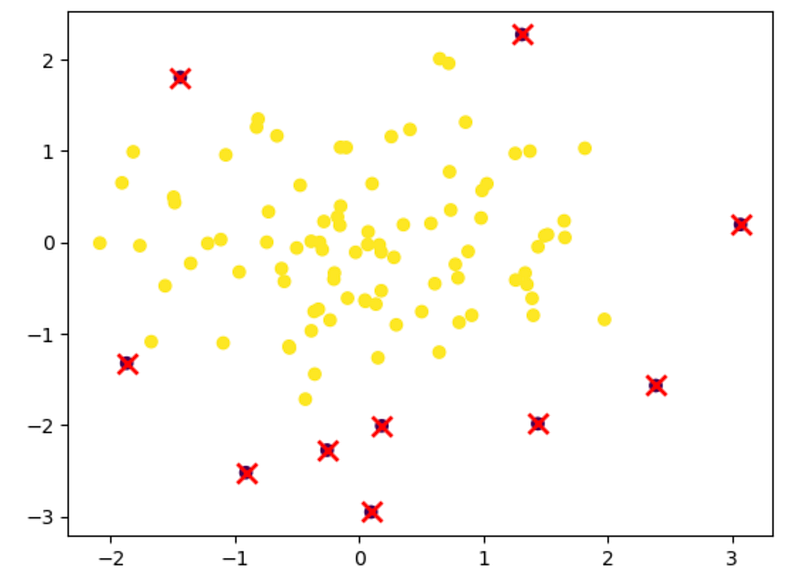
In this example, we generate 100 random data points from a 2-dimensional normal distribution with a mean of 0 and a standard deviation of 1. We then fit the LOF model to the data with a neighborhood size of 20 and identify the outliers as the data points with a label of -1. The code then plots the data and highlights the outliers with red crosses.
Conclusion
Anomaly detection is an important technique in data analysis for identifying outliers in data. By using statistical and machine learning methods, we can identify and investigate these outliers to gain valuable insights into the data. The Z-Score method, IQR method, and LOF method are just a few examples of the techniques available for identifying outliers in data. It is important to choose the right method for the specific data and analysis at hand.
Happy learning!
Want to become a Medium member to read thousands of articles?