
An Undergraduate-Level Introductory Statistics Course in 15 Minutes
A cheat sheet containing the most fundamental concepts and formulas to get you started in statistics.

Having failed math before, I was going into my first undergraduate-level statistics course in fear.
I was afraid of more than just mathematics though. I was afraid of the lack of career opportunities I would have if I couldn’t get through a simple statistics course. Obsessed with the thought of becoming a data scientist, I was terrified of not being able to build one of the fundamental skills that all data scientists need: the ability to understand and carry out statistical procedures.
I needn’t have worried though. Despite my trepidation, I passed the course easily with 82% (an A-) and killed the final exam with a final score of 92%. The notes that I’m sharing with you today are exactly those that helped me achieve success.
Before beginning to learn statistics, it’s important to know that statistics is a very “point and shoot” type of mathematics. In short, if you know the formulas and can carefully read and comprehend questions, you will be able to answer any statistical problem that comes across your desk. Statistical questions generally tell you exactly what they’re looking for as part of the answer (for example, calculate the mean, determine the standard deviation, complete a bivariate analysis, etc.).This is why the notes I’m sharing with you today are very “bare-bones” and contain mostly formulas, some vocabulary words, tables to show the relationships between concepts, and step-by-step ways of solving problems.
These notes assume an understanding of concepts such as summation notation, finding the range of a set of numbers, data visualization (understanding types of charts), basic probability, and basic algebra. These notes do leave out information on working with various distribution tables as this would dramatically increase the length of this article. Instead, the notes shared here feature the most important details — the rest can be filled in elsewhere.
Introduction
Key Terms
- Descriptive Statistics: methods for organizing, displaying, and describing data by using tables, graphs, and other summary and visualization measures.
- Inferential Statistics: methods that use sample results to make decisions or predictions about a population.
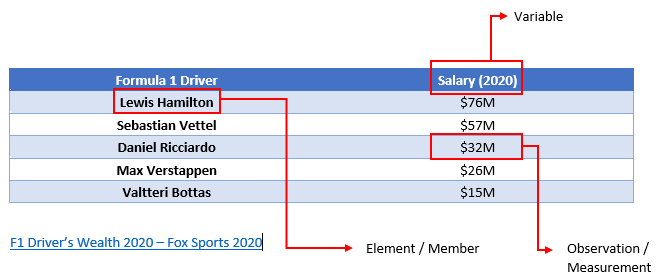
- Quantitative Variable: variable that can be measured numerically. Data collected on a quantitative variable is called quantitative data.
- Qualitative/Categorical Variable: a variable that cannot assume a numerical value but can be classified into a non-numeric category. Data collected on a qualitative variable is qualitative data.
- Population: consists of all elements whose characteristics are being studied.
- Sample: a portion of the population selected for the study.
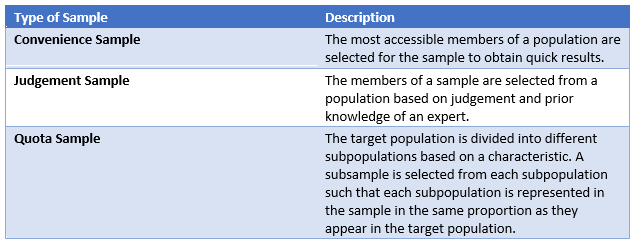
- Representative Sample: a sample that represents the characteristics of the population.
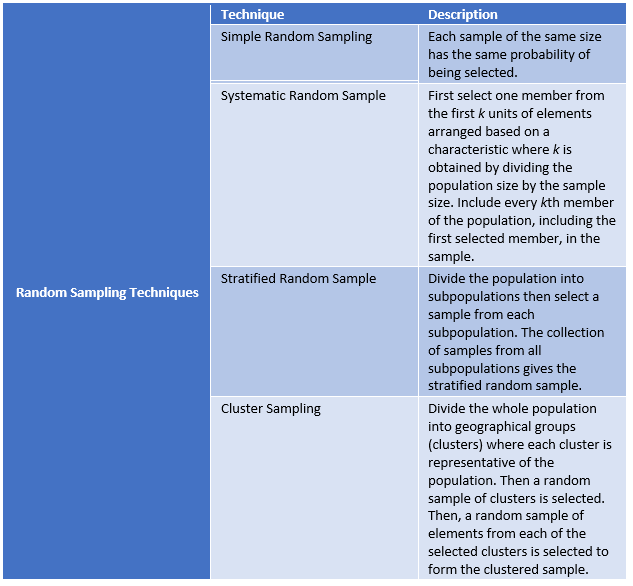
- Random Sample: sample drawn such that each member of the population has some chance of being selected in the sample.
- Nonrandom Sample: sample drawn such that some members of the population do not have a chance of being selected in the sample.
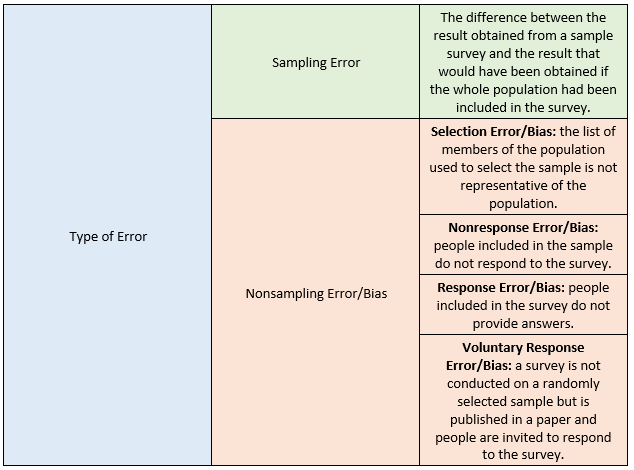
- Sampling Error: the difference between the results obtained from a sample survey and the result that would have been obtained if the whole population had been included in the survey.
- Nonsampling Error/Biases: the errors that occur in the collection, recording, and tabulation of data.
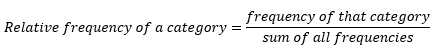
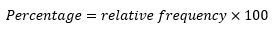
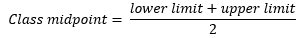
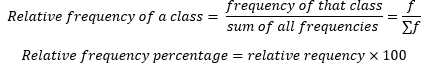
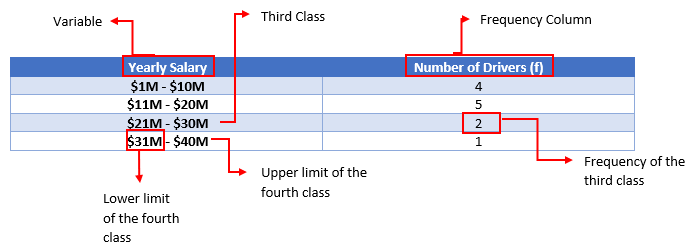
Tables
Organizing and Graphing Data
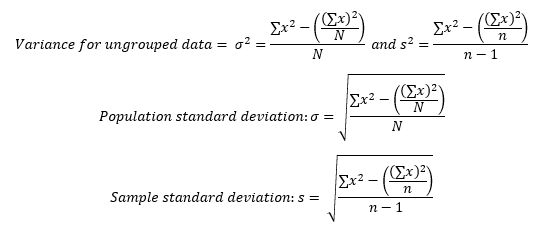
Formulas

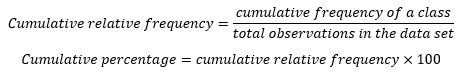
Tables
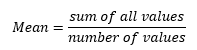
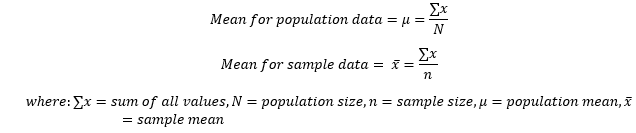
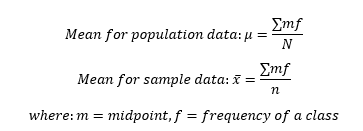
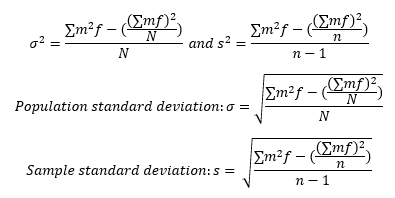
Numerical Descriptive Measures
Key Terms
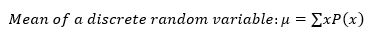
- Mean/Average: the average of a data set.
- Median: the value that divides a data set that has been ranked in increasing order in two halves. If the data set has an odd number of values, the median is given by the value of the middle term in the data set. If the data set has an even number of values, the median is given by the average of the two middle terms in the data set.
- Mode: the value that occurs with the highest frequency in a data set.
- Standard Deviation: the value that tells how closely the values of a data set are clustered around the mean. A lower value of the standard deviation indicates that the data set is spread over a smaller range around the mean. A larger value of the standard deviation indicates that the data set is spread over a larger range around the mean.
- Empirical Rule: For a bell-shaped distribution, (1) 68% of the observations lie within one standard deviation of the mean, (2) 95% of the observations lie within two standard deviations of the mean, and (3) 99.7% of the observations lie within three standard deviations of the mean.
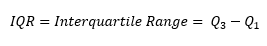
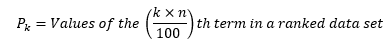
- Quartiles: three values that divide a ranked data set into four equal parts. The second quartile is the same as the median of the data set. The first quartile is the median of the observations that are less than the median. The third quartile is the median of the observations that are more than the median.
- Box-and-Whisker Plot: a plot that shows the center, spread, and skewness of a data set using the median, first quartile, third quartile, and the smallest and largest values in the data set.
Formulas
Probability
Key Terms
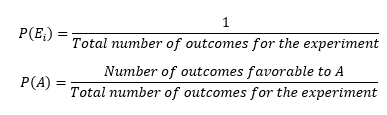
- Marginal Probability: the probability of a single event without consideration of any other event.
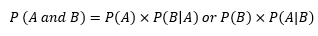
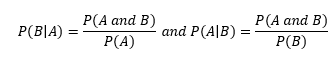
- Conditional Probability: the probability that an event will occur given that another event has already occurred. If A and B are two events, then the conditional probability of A given B is written as P(A|B).
- Independent Events: the occurrence of one event does not affect the probability of the occurrence of the other event. A and B are independent events if either P(A|B) = P(A) or P(B|A) = P(B).
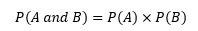
- The Intersection of Events: the intersection of A and B represents the collection of all outcomes that are common to both A and B, denoted by (A and B).
- Joint Probability: the probability of the intersection of two events, written as P(A and B).
- Joint Probability of Mutually Exclusive Events: the joint probability of two mutually exclusive events is always 0.
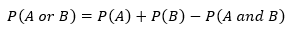
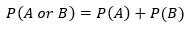
- Union of Events: the collection of all outcomes that belong to either A or B or both A and B denoted by P(A or B).
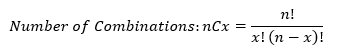
- Factorials: n! (read as “n factorial”) represents the product of all integers from n to 1.
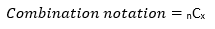
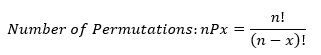
- Combinations: give the number of ways x elements can be selected from n elements.
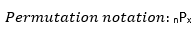
- Permutations: the total number of selections of x elements from x elements.
Formulas
Discrete Random Variables and Their Probability Distributions
Key Terms
- Random Variable: a variable whose value is determined by the outcome of a random experiment.
- Discrete Random Variable: random variable that assumes countable values.
- Continuous Random Variable: random variable that can assume any value contained within an interval.
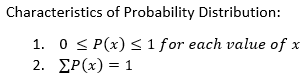
- Probability Distribution of a Discrete Random Variable: lists all of the possible values that the random variable can assume and their probabilities.
Notes
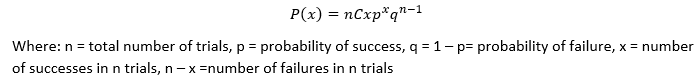
Conditions of a Binomial Experiment:
- There are n identical trials.
- Each trial has only two possible outcomes. The trials are divided into two mutually exclusive events.
- The probabilities of the two outcomes remain constant.
- The trails are independent.
Formulas


Continuous Random Variables and the Normal Distribution
Key Terms
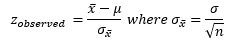
- z Values / z Scores: the units marked on the horizontal axis of the standard normal curve that gives the distance between the mean and the point represented by z in terms of standard deviation.
Notes
Normal Probability Distribution: when plotted produces a bell-shaped curve:
- The total area under the curve is 1.0.
- The curve is symmetric about the mean.
- The two tails of the curve extend indefinitely.
Formula

Sampling Distributions
Key Terms
- Population Probability Distribution: the probability distribution of the population data.
- Sampling Distribution of bar x: the probability distribution of a sample statistic that gives its sampling distribution.
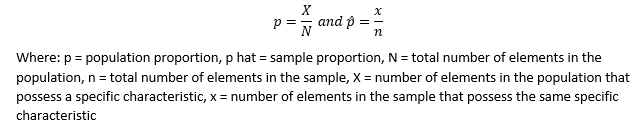
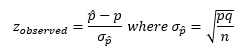
- Sampling Distribution of the Sample Proportion: the probability distribution of the sample proportion (p hat).
- Central Limit Theorem for Sample Proportion: states that the sampling distribution of p hat is approximately normal for sufficiently large sample size, such that np > 5 and nq > 5.
Formulas


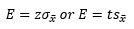
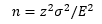
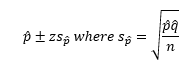
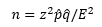
Estimation of the Mean and Proportion
Key Terms
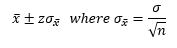
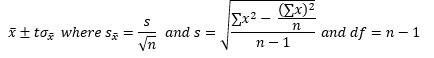
- Estimate: the value(s) assigned to a population parameter based on the value of a sample statistic.
- Estimator: the sample statistic used to estimate a population parameter.
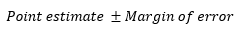
- Point Estimate: the value of a sample statistic that is used to estimate a population parameter.
- Interval Estimation: an interval constructed around the point estimate that contains the corresponding population parameter.
Notes
The estimation procedure involves:
- Select a sample.
- Collect the required information from the members of the sample.
- Calculate the value of the sample statistic.
- Assign value(s) to the corresponding population parameter.
Formulas


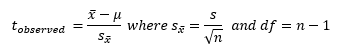
Hypothesis Tests about the Mean and Proportion
Key Terms
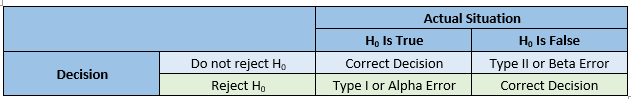
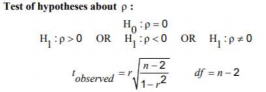
- Null Hypothesis: claim about a population parameter that is assumed to be true until it is declared false.
- Alternative Hypothesis: claim about a population parameter that will be declared true if the null hypothesis is declared to be false.
- Type I Error: occurs when a true null hypothesis is rejected.
- Type II Error: occurs when a false null hypothesis is not rejected.
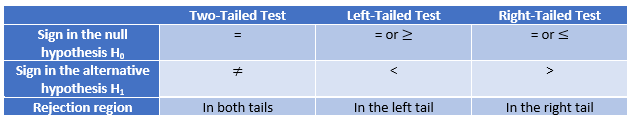
- Two-Tailed Test: has rejection regions in both tails.
- Left-Tailed Test: has the rejection region in the left tail of the distribution curve.
- Right-Tailed Test: has the rejection region in the right tail of the distribution curve.
- P-Value: the smallest significance level at which the null hypothesis is rejected.
Notes
Critical Value Approach:
- State the null and alternative hypotheses.
- Select the distribution to use.
- Determine the rejection and non-rejection regions.
- Calculate the observed value of the test statistic.
- Make a decision and write a conclusion.
P-Value Approach:
- State the null and alternative hypotheses.
- Select the distribution to use.
- Calculate the p-value.
- Make a decision.
Formulas
Tables
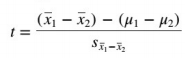
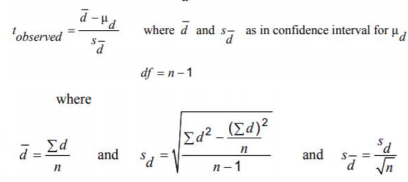
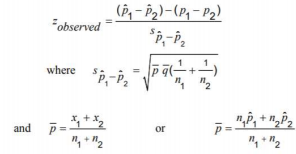
Estimation and Hypothesis Testing: Two Populations
Key Terms
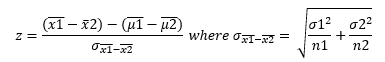
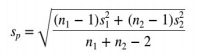
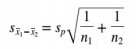
- Independent Samples: two samples drawn from two populations where the selection of one sample from one population does not affect the selection of the second sample from the second population.
- Dependent Samples: two samples drawn from two populations where the selection of one sample from one population does affect the selection of the second sample from the second population.
- Paired/Matched Samples: two samples when for each data value collected from one sample there is a corresponding data value collected from the second sample and both of these data values are collected from the same source.
Formulas
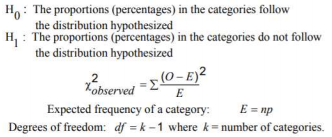
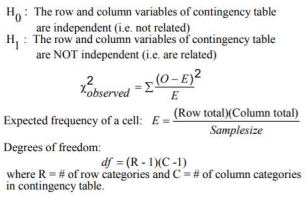
Chi-Square Tests
Key Terms
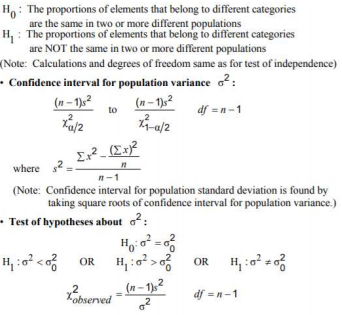
- Chi-Square Distribution: distribution that has only one parameter (degrees of freedom). The shape of this distribution curve is skewed to the right for small degrees of freedom and becomes symmetric for large degrees of freedom. The entire distribution lies to the right of the vertical axis. This distribution assumes nonnegative values only.
- Observed Frequencies: the frequencies obtained from the performance of an experiment, denoted by O.
- Expected Frequencies: the frequencies that we expect to obtain if the null hypothesis is true. Obtained as E = np.
- Test of Homogeneity: involves testing the null hypothesis that the proportions of elements with certain characteristics in two or more different populations are the same against the alternative hypothesis that these proportions are not the same.
Notes
A Multinomial Experiment: an experiment with the following characteristics is a multinomial experiment:
- The experiment consists of n identical trials.
- Each trial results in one of k possible outcomes where k > 2.
- The trials are independent.
- The probabilities of the various outcomes remain constant for each trial.
Formulas
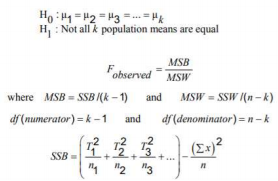
Analysis of Variance
Key Terms
- ANOVA: a procedure that is used to test the null hypothesis that the means of three or more populations are all equal.
- Mean Square Between Samples (MSB): a measure of the variation among the means of samples taken from different populations.
- Mean Square Within Samples (MSW): a measure of the variation within the data of all samples taken from different populations.
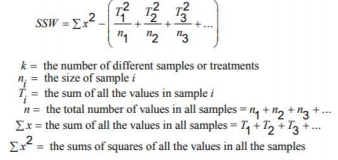
- SSB: the sum of squares between samples.
- SST: the total sum of squares.
- SSW: the sum of squares within samples.
Notes
The F Distribution:
- The F distribution is continuous and skewed to the right.
- The distribution has two numbers of degrees of freedom: df for the numerator and df for the denominator.
- The units of an F distribution are nonnegative.
Assumptions of One-Way ANOVA:
- The populations from which the samples are drawn are approximately normally distributed.
- The populations from which the samples are drawn have the same variance or standard deviation.
- The samples drawn from different populations are random and independent.
- The one-way ANOVA is always right-tailed.
Formulas
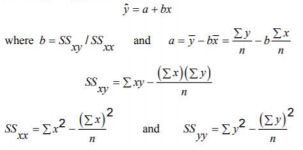
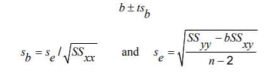
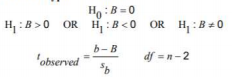
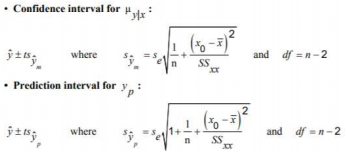
Simple Linear Regression
Key Terms
- Simple Regression: a model that describes the relationship between two or more variables that includes only two variables: one independent and one dependent.
- Linear Regression: a simple regression model that gives a straight-line relationship between two variables.
- Least Squares Estimate of A and B: the values of a and b of A and B that are calculated by using the sample data.
- Least Squares Method: the method used to fit a regression line through a scatter diagram such that the error sum of squares is at a minimum.
- Least Squares Regression Line: a regression line obtained by using the least-squares method.
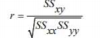
- Linear Correlation Coefficient: a measure of the strength of the linear relationship between two variables.
- Multiple Regression Model: regression model that contains two or more independent variables.
- Positive Relationship Between Two Variables: the value of the slope in the regression line and the correlation coefficient between the two variables are both positive.
- Negative Relationship Between Two Variables: the value of the slope in the regression line and the correlation coefficient between the two variables are both negative.
- Slope: the coefficient of x in a regression model that gives the change in y for a change of one unit in x.
- SSE (Error Sum of Squares): the sum of the squared differences between the actual and predicted values of y.
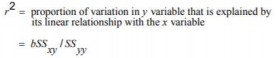
- SSR (Regression Sum of Squares): the portion of the SST that is explained by the regression model.
- SST (Total Sum of Squares): the sum of the squared differences between actual y values and y.
- Standard Deviation of Errors: a measure of the spread for the random errors.
Formulas

Final thoughts and additional resources.
While this cheat sheet is a good place to start, there are a ton of resources online that can help you further deepen your understanding of statistical concepts. Listed below are some of my favorites:
When it comes to studying statistics, repetition and consistency are key. Rarely are problems difficult to solve when you know what you’re looking for and how to look for it. By becoming familiar with the most important formulas and procedures for finding the values that you need, you’ll be able to solve any statistics problem that comes across your desk in no time.


