
An OOP Integration of FinViz Data for quantitative trading
Developping securities universe classes in Python
Published on 16th February 2024.

Introduction
This article introduces the StockUniverse class, designed for integrating financial data from FinViz into trading strategies. As the foundational class, StockUniverse facilitates the loading and preliminary analysis of data through functionalities such as data retrieval by ticker and financial health assessments. Its primary role is to enable the efficient use of FinViz data within financial market analyses.
Additionally, we detail two subclasses, HighMomentumStocks and UndervaluedUniverse, which extend StockUniverse to focus on specific behaviors of stocks. These subclasses do not directly integrate FinViz data but utilize the StockUniverse framework for identifying stocks based on momentum and valuation criteria, respectively. The integration of FinViz data is exclusive to the StockUniverse class, underscoring its significance in data-driven trading strategy development.
This discussion aims to outline the capabilities and applications of the StockUniverse class and its extensions, highlighting their contribution to the formulation of informed trading strategies through the strategic use of FinViz data.
1. FinViz
FinViz stands as a leading financial visualization platform, renowned for its comprehensive suite of tools and datasets tailored for financial analysis. The platform provides users with extensive stock screening capabilities, detailed financial data, and sophisticated analytical features. Notably, even its free tier includes robust screeners that enable filtering based on technical indicators, financial metrics, and company characteristics. However, for the purposes outlined in this article, particularly the integration with the Universe Class, it is essential to opt for the premium subscription. This paid tier unlocks the capability to export data — a feature integral to my trading routine. The export function allows users to select specific metrics, which are then provided in the form of a CSV file, facilitating seamless integration and analysis within our trading framework.
Selecting Industry ‘Stocks only (ex-funds)’ and average volume ‘Over 1M’ gives access to the list of the 1646 most liquid US Equities:

Dataset containing all the metrics and indicators available can be accessed through ‘Custom’ tab and it can be downloaded by clicking on ‘Export’ on the bottom right corner of the table.
To explore these advanced features and consider subscribing to the premium tier, please follow this affiliate link. By using this link, you not only gain access to FinViz’s premium features but also support my work.
2. A base universe class to handle FinViz export
The StockUniverse class is a Python tool for processing financial data from CSV files. On initialization, it loads data from a specified file path into a pandas DataFrame. Its load_data method attempts to read the CSV file, returning an empty DataFrame if the file is not found, alongside an error message.
The class features a get_company_data method for retrieving specific company data by ticker symbol, returning either the data row or an error message if the ticker is not found. The generate_financial_message method compiles key financial metrics into a summary message, including ROA, ROE, and various debt-to-equity ratios, providing a snapshot of a company's financial health.
extract_financial_ratios extracts and returns a dictionary of financial ratios from the company data. The class is designed for extension, with a filter_stocks method intended for subclass implementation to apply specific stock filtering criteria. The filter_and_extract_ratios method outlines how to combine stock filtering with financial ratio extraction, though the actual filtering logic is to be defined in subclasses.
In essence, StockUniverse facilitates efficient financial data analysis and serves as a foundation for building customized trading strategies through subclassing.
import pandas as pd

class StockUniverse:
    def __init__(self, file_path):
        """Initialize the StockUniverse class with a file path to the data.
        Args:
            file_path (str): The path to the CSV file containing stock data.
        """
        self.file_path = file_path
        self.data = self.load_data()

    def load_data(self):
        """Attempt to load stock data from a CSV file specified during initialization.
        Returns:
            pd.DataFrame: The loaded stock data or an empty DataFrame if the file is not found.
        """
        try:
            return pd.read_csv(self.file_path)
        except FileNotFoundError:
            print(f"File not found: {self.file_path}")
            return pd.DataFrame()  # Return an empty DataFrame if file is not found.

    def get_company_data(self, ticker):
        """Retrieve financial data for a specific company using its ticker symbol.
        Args:
            ticker (str): The ticker symbol of the company.
        Returns:
            tuple: A tuple containing the company's data row (or None if not found) and an error message (or None if data is found).
        """
        company_data = self.data[self.data['Ticker'] == ticker]
        if company_data.empty:
            return None, f"No data available for ticker: {ticker}"
        return company_data.iloc[0], None  # Return the first matching row and None for error.

    def generate_financial_message(self, financial_data, ticker):
        """Generate a summary message of key financial ratios for a given company.
        Args:
            financial_data (pd.Series): Financial data for the company.
            ticker (str): The ticker symbol of the company.
        Returns:
            str: A formatted message string summarizing the company's key financial ratios.
        """
        message = f"ROA: {financial_data['ROA']}%, "
        message += f"ROE: {financial_data['ROE']}%, "
        message += f"Current Ratio: {financial_data['Current Ratio']}, "
        message += f"Quick Ratio: {financial_data['Quick Ratio']}, "
        message += f"LT Debt to Equity: {financial_data['LT Debt/Equity']}, "
        message += f"Total Debt to Equity: {financial_data['Total Debt/Equity']}, "
        message += f"Profit Margin: {financial_data['Profit Margin']}%."
        return message

    def filter_stocks(self):
        """Placeholder method to be overridden by subclasses for stock filtering.
        Raises:
            NotImplementedError: Indicates that this method should be implemented by subclasses.
        """
        raise NotImplementedError("This method should be overridden by subclasses.")

    def extract_financial_ratios(self, ticker):
        """Extract and return financial ratios for a given company.
        Args:
            ticker (str): The ticker symbol of the company.

        Returns:
            dict: A dictionary of financial ratios or None if data is not found or an error occurs.
        """
        company_data, error = self.get_company_data(ticker)
        if error or company_data is None:
            print(error)
            return None  # Return None if there's an error or data is not found.

        # Extract financial ratios from the company data.
        return {
            'ROA': company_data['Return on Assets'],
            'ROE': company_data['Return on Equity'],
            'Current Ratio': company_data['Current Ratio'],
            'Quick Ratio': company_data['Quick Ratio'],
            'LT Debt/Equity': company_data['LT Debt/Equity'],
            'Total Debt/Equity': company_data['Total Debt/Equity'],
            'Profit Margin': company_data['Profit Margin']
        }

    def filter_and_extract_ratios(self):
        """Filter stocks using a subclass-specific method and extract financial ratios for the filtered stocks.
        Returns:
            dict: A dictionary mapping tickers to their financial summary messages.
        """
        filtered_stocks = self.filter_stocks()  # Expected to be implemented in a subclass.
        financial_summaries = {}
        for _, row in filtered_stocks.iterrows():
            ticker = row['Ticker']
            ratios = self.extract_financial_ratios(ticker)
            if ratios:
                summary_message = self.generate_financial_message(ratios, ticker)
                financial_summaries[ticker] = summary_message
        return financial_summaries
This class is primarily designed to compile a list of tickers and does not extend to generating financial summaries for the approximately 1600 tickers it encompasses. Generating detailed financial analyses is more efficiently conducted on a select subset of companies. This is achieved through subclassing, where more focused and specific financial summaries can be tailored to a restricted number of companies.
In the below example, the 10 first tickers of the universe are displayed:

3. The high momentum stocks universe
The HighMomentumStocks class is a specialized subclass of StockUniverse designed for filtering and selecting stocks with high momentum indicators from a CSV file containing market data. It initializes by accepting a file path and the number of stocks to be selected based on momentum criteria. The class first standardizes column names for clarity, then converts relevant columns to numeric formats to ensure accurate calculations. It applies specific filtering criteria, such as the arrangement of short-term, medium-term, and long-term simple moving averages (SMA20 > SMA50 > SMA200), market capitalization below a set threshold, and relative volume greater than one, to identify stocks demonstrating high momentum. Additionally, it calculates a composite score for each stock by averaging the percentiles of price to target change, volume change, and price to target percentage. This score is used to rank stocks, and the top performers based on the specified number at initialization are selected. This methodology enables the identification of stocks likely to exhibit continued upward momentum, providing a data-driven approach to momentum investing.
For an in-depth understanding of the methodology used to identify high momentum stocks on the verge of breaking out, please refer to the article "Identifying Breakout Stocks with Python: A Data-Driven Selection Guide." This guide provides a factual and analytical framework for selecting stocks using Python, focusing on data-driven criteria and techniques.
class HighMomentumStocks(StockUniverse):
    def __init__(self, file_path, number_stocks=10):
        """Initialize the HighMomentumStocks class by specifying a CSV file path and the number of high momentum stocks to select.
        Args:
            file_path (str): The path to the CSV file containing stock data.
            number_stocks (int): The number of high momentum stocks to filter and select.
        """
        super().__init__(file_path)
        self.number_stocks = number_stocks

    def filter_stocks(self):
        """Filter stocks based on high momentum criteria using moving averages, market cap, and relative volume.
        Renames columns for consistency, converts necessary columns to numeric types, and applies filtering logic
        to identify high momentum stocks. Further, it calculates a composite score based on price to target percentage,
        change percentile, and volume percentile to rank stocks.

        Returns:
            pd.DataFrame: A DataFrame containing the top stocks selected based on the composite score, limited to the number specified at initialization.
        """
        # Map to rename columns for clarity and consistency.
        columns_rename_map = {
            '20-Day Simple Moving Average': 'SMA20',
            '50-Day Simple Moving Average': 'SMA50',
            '200-Day Simple Moving Average': 'SMA200',
            'Relative Volume': 'Rel Volume'
        }
        self.data.rename(columns=columns_rename_map, inplace=True)

        # Inner function to convert columns to numeric, handling percentages and commas.
        def convert_to_numeric(column):
            return pd.to_numeric(self.data[column].astype(str).str.replace('%', '').str.replace(',', ''), errors='coerce')

        # List of columns to convert for accurate calculations.
        numeric_columns = ['SMA20', 'SMA50', 'SMA200', 'Rel Volume', 'Market Cap', 'Target Price', 'Price', 'Change', 'Volume']
        for col in numeric_columns:
            self.data[col] = convert_to_numeric(col)

        # Apply filtering criteria for high momentum.
        high_momentum_df = self.data[
            (self.data['SMA20'] > self.data['SMA50']) &
            (self.data['SMA50'] > self.data['SMA200']) &
            (self.data['Market Cap'] < 10000) &
            (self.data['Rel Volume'] > 1)
        ].copy()

        # Calculate metrics for ranking high momentum stocks.
        high_momentum_df['Price to Target %'] = ((high_momentum_df['Target Price'] - high_momentum_df['Price']) / high_momentum_df['Price']) * 100
        high_momentum_df['Change Percentile'] = high_momentum_df['Change'].rank(pct=True)
        high_momentum_df['Volume Percentile'] = high_momentum_df['Volume'].rank(pct=True)
        high_momentum_df['Price to Target Percentile'] = high_momentum_df['Price to Target %'].rank(pct=True)
        high_momentum_df['Composite Score'] = high_momentum_df[['Change Percentile', 'Volume Percentile', 'Price to Target Percentile']].mean(axis=1)

        # Sort by composite score and select the top stocks.
        high_momentum_df.sort_values('Composite Score', ascending=False, inplace=True)

        return high_momentum_df.head(self.number_stocks)
Here is an example of use:

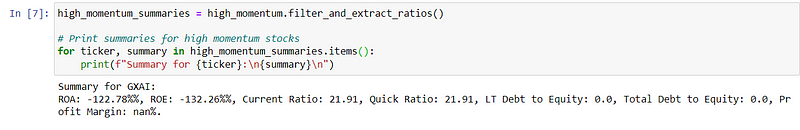
4. The undervalued stocks universe
The UndervaluedUniverse class extends the StockUniverse base class to systematically identify stocks that are potentially undervalued in the market. This functionality is realized through the processing of financial data contained within FinViz export.
The operational process begins with the normalization of financial column names to ensure data consistency. Subsequent steps involve converting key financial metrics into numeric format, critical for executing accurate financial analysis. The class employs a defined set of financial thresholds targeting metrics such as the Current Ratio, Profit Margin, Return on Assets (ROA), Return on Equity (ROE), Long-Term Debt to Equity Ratio (LT Debt/Equity), as well as valuation ratios including Price to Earnings (P/E), Price to Book (P/B), and Earnings Per Share (EPS) for the trailing twelve months (ttm).
To discern undervalued stocks, the class applies these criteria, filtering the dataset to isolate stocks that meet or exceed the specified financial health and valuation benchmarks. It further refines this selection by calculating a composite score for each qualifying stock. This score is determined by averaging the percentile ranks of the P/E ratio, P/B ratio, and EPS, which collectively provide a quantitative measure of undervaluation.
Stocks are ranked based on their composite scores, with the highest-scoring stocks deemed most undervalued. The class ultimately selects the top-ranked stocks up to the number specified during its initialization. This methodical and quantitative approach allows for the identification of stocks that, according to specific financial metrics and valuation criteria, are priced below their intrinsic value by the market, offering a strategic tool for value-driven investment decisions.
For an explanation of the methodology employed here, please refer to the article ‘Using fundamental analysis to identify undervalued stocks’.
class UndervaluedUniverse(StockUniverse):
    def __init__(self, file_path, number_stocks=10):
        """Initializes the UndervaluedUniverse class with a path to the CSV data file and a specified number of stocks to select.
        Args:
            file_path (str): The path to the CSV file containing stock data.
            number_stocks (int): The number of undervalued stocks to identify.
        """
        super().__init__(file_path)  # Initializes the superclass with the file path.
        self.number_stocks = number_stocks  # Sets the number of stocks to select.
        # Defines financial thresholds for filtering undervalued stocks.
        self.thresholds = {
            'Current Ratio': 1.5,
            'Profit Margin': 0,
            'Return on Assets': 0.05,
            'Return on Equity': 0.1,
            'LT Debt/Equity': 0.5,
            'P/E': (0, float('inf')),
            'P/B': 1,
            'EPS (ttm)': 0
        }

    def convert_to_numeric(self, column):
        """Converts specified column values from strings to numeric format, handling percentages and commas.
        Args:
            column (str): The column name to convert.
        Returns:
            Series: A pandas Series with the column values converted to numeric format.
        """
        # Check if column is already numeric and convert string values to numeric where necessary.
        return pd.to_numeric(self.data[column].astype(str).str.replace('%', '').str.replace(',', ''), errors='coerce')

    def filter_stocks(self):
        """Filters the stock dataset to identify undervalued stocks based on predefined financial health and valuation criteria.

        Converts specified financial columns to numeric format for analysis, applies thresholds to filter undervalued stocks,
        and calculates a composite score to rank these stocks.

        Returns:
            DataFrame: A pandas DataFrame containing the top-ranked undervalued stocks according to the composite score.
        """
        # Convert specified columns to numeric for accurate financial analysis.
        numeric_columns = ['Current Ratio', 'Profit Margin', 'Return on Assets', 'Return on Equity',
                           'LT Debt/Equity', 'P/E', 'P/B', 'EPS (ttm)', 'Rel Volume', 'Average Volume']
        for col in numeric_columns:
            self.data[col] = self.convert_to_numeric(col)

        # Apply filters based on the defined thresholds for undervaluation.
        undervalued_df = self.data[
            (self.data['Current Ratio'] > self.thresholds['Current Ratio']) &
            (self.data['Profit Margin'] > self.thresholds['Profit Margin']) &
            (self.data['Return on Assets'] > self.thresholds['Return on Assets']) &
            (self.data['Return on Equity'] > self.thresholds['Return on Equity']) &
            (self.data['LT Debt/Equity'] < self.thresholds['LT Debt/Equity']) &
            (self.data['P/E'] > self.thresholds['P/E'][0]) &
            (self.data['P/E'] < self.thresholds['P/E'][1]) &
            (self.data['P/B'] < self.thresholds['P/B']) &
            (self.data['EPS (ttm)'] > self.thresholds['EPS (ttm)'])
        ].copy()

        # Calculate a composite score to rank the filtered undervalued stocks.
        undervalued_df['Composite Score'] = (
            undervalued_df['P/E'].rank(pct=True) +
            undervalued_df['P/B'].rank(pct=True) +
            undervalued_df['EPS (ttm)'].rank(pct=True, ascending=False)
        ) / 3
        # Select the top stocks based on the composite score.
        top_undervalued_stocks = undervalued_df.sort_values('Composite Score').head(self.number_stocks)

        return top_undervalued_stocks
Here is an example of use:
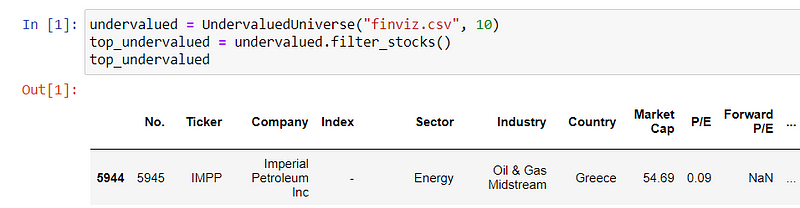
Conclusion
This article has detailed the development and application of the StockUniverse class alongside its derivatives, HighMomentumStocks and UndervaluedUniverse, for integrating FinViz financial data into algorithmic trading strategies. These classes provide a structured approach to loading, analyzing, and filtering stock data, facilitating the identification of stocks based on predefined momentum and valuation criteria. The StockUniverse class serves as the core component for data manipulation, while its subclasses offer tailored functionalities for targeting specific stock characteristics. Through this object-oriented methodology, the framework supports the strategic evaluation of stocks, contributing to more informed and data-driven trading decisions.
Disclaimer: The information provided in this article is intended solely for educational purposes and should not be taken as investment advice or a recommendation to engage in trading activities. Financial trading involves significant risk, including the potential loss of capital. The accuracy of the data or the effectiveness of the strategies discussed cannot be guaranteed. Readers are advised to conduct their own due diligence and consult with a professional financial advisor before making any investment decisions. The author and publisher of this article disclaim any liability for losses or damages resulting from the use of the information contained herein. Readers should always verify the currentness of the programming approaches and financial strategies due to the rapidly evolving nature of technology and financial markets.
A Message from InsiderFinance

Thanks for being a part of our community! Before you go:
- 👏 Clap for the story and follow the author 👉
- 📰 View more content in the InsiderFinance Wire
- 📚 Take our FREE Masterclass
- 📈 Discover Powerful Trading Tools