
Algorithmic Trading with Python: Does Two Week Magnitude Effect Current Returns
Algo Trading with Python — Strategy 1: Test If Historical Returns Can Help Indicate Future Daily Momentum

This will be the starting article on a series of articles titled Algorithmic Trading with Python.
I want to demonstrate the ease and general practice of trading in various market scenarios, conditions, and security types. To develop and research this algorithm, I will be using the QuantConnect Platform:
This article will cover the following: ∘ CONCEPT ∘ DESIGN ∘ RESEARCH ∘ DEVELOPMENT ∘ BACK-TESTING ∘ FORWARD-TESTING ∘ DEPLOYMENT
To design the algorithm, I will use Lucid.
I find it a good habit to visualize my algorithms in the design portion of the steps. I also like to write pseudocode to help stamp out static parameter values and figure out the logic of the code as well. To do the pseudocode I use any good text editor I choose VSCode as I find it suitable, and the syntax highlighting is extremely effective for the readability of your work.
I chose to do this project in the Python Programming Language. The two main reasons for this are that QuantConnect has integrated Python heavily into their platform as the most accepted language for their IDE in the community, but also because Python is a great language for understanding how your code is working and for beginners to quickly get their hands dirty with a simpler language.
To start we need a clever idea or concept of a strategy. I will start this series with a simple algorithm. The algorithm will also be utilizing QuantConnect’s algorithm framework. This allows you to be creative in the way you build while retaining the robustness of relying on a proven and efficient architecture. Because of these factors, you can build professional, well-engineered, and unique algorithmic trading systems fairly easily.
I will grade my algorithm using QuantConnect’s PSR ratio, which is a good single-point measurement for quick overall performance review, but I will go into other performance and statistical measurements as well.
I find QuantConnect to be a great research and algorithmic trading platform. Not only do they offer a great education bootcamp, but they also offer a full ecosystem of top-notch quants. The community forums, a Discord Server, mixed with the beautiful IDE, API, Research Notebook, Documentation, Licensing Marketplace (Alpha Streams), and too many other features and helpers to list them all for time's sake.
If you want to know more about them, take a look at the website https://quantconnect.com. QuantConnect really works for me because it covers many of the hurdles that come with algorithmic trading, such as working with large broker APIs, dealing with getting clean reliable data, slippage, trading fees, price adjustments, following well-accepted guidelines, local and cloud development, and many other factors. It really is just a suitable place to start as a Quant in my opinion.
This article assumes you know the basics of Python, the QuantConnect platform, API, and Documentation, and some basic knowledge of statistics. If you want to learn more about Python, check out some of my other articles on the subject on my Medium page. To learn more about QuantConnect They offer tutorials, a Bootcamp, a strategy library, great documentation, the community forum, and a Discord Server.
There is also a great site called Quantpedia that offers a great service for Quants by delivering a gigantic 600+ Algorithmic Trading Strategies research pre-done by professionals and that isn’t it, 500+ Trading Strategies that include QuantConnect code, at the time of authoring this article. One use for this is that it is meant to give Quants a great place to start for their next strategy.
They also offer much more with a great screener for these strategies and a Pro service that gives you a ton of extra features and tools. I really recommend checking it out more in-depth. I will list them below:
This first strategy is going to be mostly modifying an existing Alpha Model. This model is in the Alpha Creation section of QuantConnect’s Docs.
I do not recommend trading real money with this algorithm, nor is any of this to be considered financial advice. This is merely entertainment for learning purposes only. I am also not affiliated with QuantConnect and this article is not a promotion for them. I am just a satisfied fan of the platform.

Resources
My QuantConnect Algorithm Backtest & Research Notebook. Also, below is the forum discussion I started about this strategy.
Here is my GitHub repo for this algorithm.
Here is the 2nd strategy in this series so far.
CONCEPT

Question:
Does Two Week Magnitude Affect Current Returns for a liquid equity stock selected from a dynamic universe along with 249 others, rebalanced daily? In addition, can that edge be taken advantage of to create a profitable alpha for a trading algorithm?
Hypothesis:
If 14-day returns do have a correlation with single-day/multi-day momentum, can I use this indicator to create signals for insights on both longing and shorting equities associated with the signal?
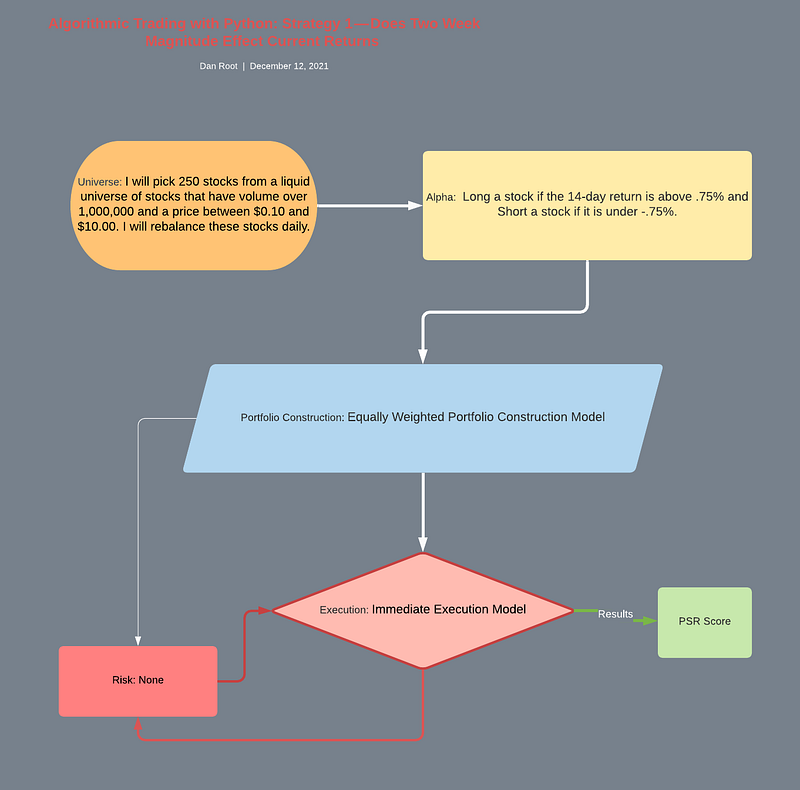
Universe:
I will pick 250 stocks from a liquid universe of stocks that have a volume of over 1,000,000 and a price between $0.10 and $10.00. I will rebalance these stocks once a day. This will give me a good dynamic range of stocks that I can use to trade my algorithm, which can help with overfitting and selection bias.
Alpha:
Ideally, I want to Long a stock if the 14-day return is above .75% and Short a stock if it is under -.75%. Something to note is this is the basic and flexible starting alpha. You should never work on a simple alpha too much if the results are not significant and you are just tuning the performance to cherry-pick trades that will look great on a back-test, but do not actually hold their ground with new data.
The reason that this is a flexible alpha strategy is that during the design, research, development, and back-testing stage you may want to change key concepts, design principles, and development models to achieve a better overall strategy.
Portfolio:
The portfolio model I will be using in this model is going to be an Equally Weighted Portfolio Construction Model that is pre-built by QuantConnect and implements an equal cut of weight to all assets in the portfolio.
Execution:
I will be utilizing the pre-built Execution Model from QuantConnect, Immediate Execution Model. This model just immediately invokes your orders when the insights associated are emitted if there is enough portfolio allocation to cover the trade.
Risk:
We will not be choosing a risk model for this strategy, but I encourage anyone reading to implement your own or any pre-built risk models and share your story with what happens on the QC forums or by replying to this article!
DESIGN

During this stage, I like to focus on getting my pseudocode nailed down and my key logic to be worked out for later. During this stage I either open notepad (usually to start with) or the VSCode (usually after I get some key pieces written out). First, I start with keynotes that I deem important off the bat.
Key Notes
- The Alpha of the strategy is going to be where I am spending most of my time, as that is where most of the coding logic resides.
- The Universe function will incorporate sorting and filters to accomplish what I need.
- I have no idea the outcome of these tests and thus want to remain without bias throughout the testing process. The only thing to look for is the results.
- The Strategy may be a reverting strategy in meaning it indicates reversals and signals should be used backward.
- The alpha strategy may do better with different universe models, portfolio models, execution models, and risk models.
- I am always willing to do some tuning and tweaking if results are not ideal before I through a strategy out but will also balance that with not spending too much time if the strategy is not producing strong results.
Next, before I write my pseudocode I like to create a flow chart on Lucid. https://lucid.app/
Pseudocode
Universe:
Sort universe of stocks by dollar volume.
Filter out 250 of the highest dollar volume equity stocks from this sorted list.
Alpha:
If selected equity has a 14-day return higher than .75% or lower than -.75% trade the stock via long for up and short for down. Insights will be for 1–14 days. This is where the insights are created and the trading logic for the alpha strategy lives. The alpha model is a Class and as such, it has three main methods. The main Python initialization function __init__(), Update() where the magic happens and trading signals are emitted and OnSecuritiesChanged() handles what happens when securities change in the universe.
Also, it is good to note you can access algorithm variables when inside of other models or classes using the algorithm object, much how you would use self when coding inside of the main algorithm class. In the Alpha model, I will also use a SymbolData() class to help with the Rate Of Change Percent Indicator. The methods that are being used for this Class are similar and come pre-coded for this project in the Magnitude Alpha Model that we started out with. I will list them below.
__init__() # standard init functionRegisterIndicators() # Registers Indicators https://www.quantconnect.com/docs/algorithm-reference/indicatorsRemoveConsolidators() # Removes any consolidators https://www.quantconnect.com/docs/algorithm-reference/consolidating-dataWarmUpIndicators() # Warms up indicators with historical https://www.quantconnect.com/docs/algorithm-reference/indicatorsReturn() # Returns the indicator valueCanEmit() # lets us know if the indicator can emit insightsPortfolio:
Will weight insights equally.
Execution:
Immediately execute tradable orders that have enough capital allocation.
Risk:
None.
RESEARCH

In my opinion, research is not only important but in most cases necessary to conduct within my algorithm construction workflow. The reason for this is that if I don’t use the research environment and actually explore my data and strategy to a more visual and logical level.
When I don’t use the research environment I often find myself thinking I have a full understanding of the algorithm but in reality, I have not done enough EDA, Testing, and Research to have a valid grasp of what is going on under the hood. In these scenarios, I have to go back to the research environment to get a full understanding.
This is not necessarily true for all Algorithms, and I usually leave exceptions to using the research environment if either the algorithm is simple enough or clearly understandable by using the debugging and logging features of the Development IDE provided by QuantConnect.
In addition, I do not always use the research environment only in the beginning. Because QuantConnect makes it easy to work with objects that are coded in the development environment in your research environment, it can be extremely useful to use the research environment throughout the development workflow as needed.
I will be using QuantConnect’s Research Notebook to conduct my research for this project. You can find my notebook linked at the top of this article under resources. While researching I am getting a good feel of how the strategy code will look like.
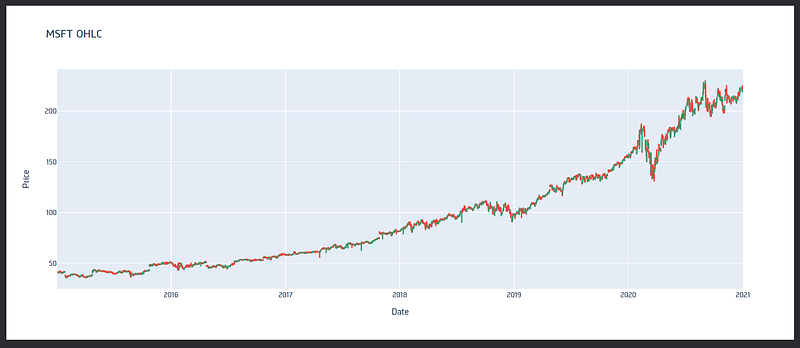
I begin by using a single security in the notebook “MSFT”. This will be enough for me to work out the code necessary to program the actual algorithm. Now, I need to load up the RateOfChangePercent() Indicator, as this will give us the returns we need. I also import plotly.graph_objects as go. This will be used in the second code block to visualize the Microsoft price chart to better understand the security we are dealing with while researching.
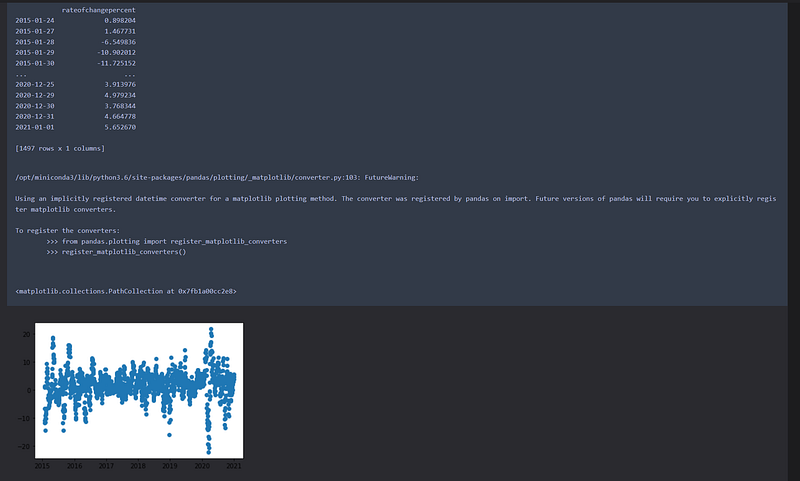
Here is the visual of the Microsoft chart now in the second block.
Now I will work the logic portion of the code out to get the signals I need to trade on. Using the Plotly I will also create an interactive chart like the one on block two, but this time I will add the signal as text and that should give a good idea if the strategy is working or not.
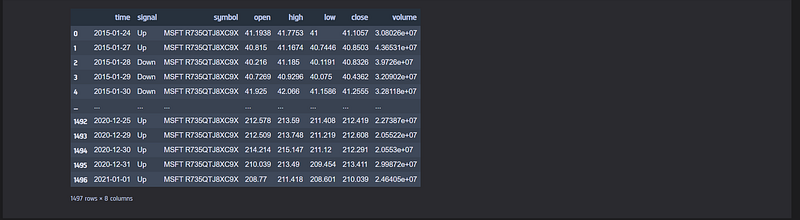
Now time to plot the chart out with the signals included.
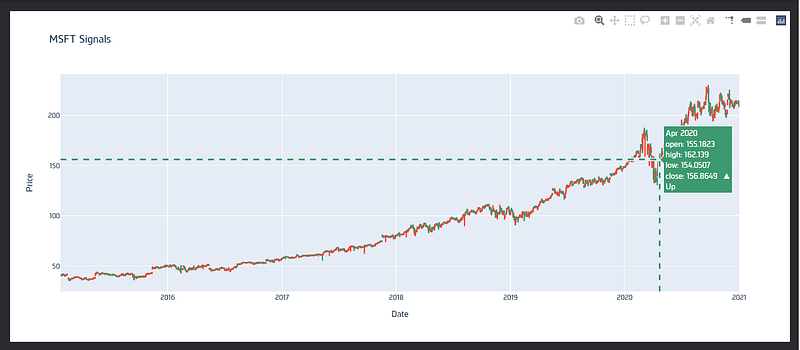
After looking over the chart produced in Research Block Four, I can conclude that the strategy does look like it is working correctly so far. This is enough for me to work off when I start to code the strategy in the next section.
DEVELOPMENT

The development will start with setting up our Algorithm Class with the use of some pre-build models provided by QuantConnect by utilizing The Algorithm Framework. This comes with many benefits, such as separation of concerns, modularity, debugging, and readability to name a few.
The Setup
The first is the Equal Weighted Portfolio Construction Model self.SetPortfolioConstruction(EquallyWeightingPortfolioConstructionModel()). The second is the Immediate Execution Model self.SetExecution(ImmediateExecutionModel()). The third is the Coarse Universe Selection Model self.SetUniverseSelection(CoarseFundamentalUniverseSelectionModel(self.CoarseSelectionFunction)).
And last the Historical Returns Alpha Model. Now I will add my to the beginning of the original Alpha Model (HistoricalReturnsAlphaModel(14, Resolution.Daily) to make it unique. self.AddAlpha(MyHistoricalReturnsAlphaModel(14, Resolution.Daily)). This Alpha-model I will be altering to fit the needs of the strategy.
There will be no risk in this strategy as of now, as I prefer to add risk towards the end of the back-testing phase. This is because when I am adding risk it can sometimes add noise to the strategy results and skew the actual strategy. There are some exceptions to this, as some strategies include risk as a base part of the concept, but for this strategy, I will start with the no-risk model.
Now for programming the universe out. The following code sorts the universe by dollar volume. It then filters stocks that are a price between $0.10 and $10.00 and a volume over 1,000,000. This is arbitrary and can be tweaked and tuned or changed completely for this strategy. This universe gives us the top 250 securities that match these conditions.
def CoarseSelectionFunction(self, coarse):
 sortedByDollarVolume = sorted(coarse, key=lambda x: x.DollarVolume, reverse=True)
 filtered = [ x.Symbol for x in sortedByDollarVolume if x.HasFundamentalData and x.Price >= .1 and x.Price <= 10 and x.DollarVolume > 1000000 ]
 return [ x for x in filtered[:250] ]
The Algorithm
Next, we change the existing Historical Returns Alpha Model provided by QuantConnect.
I started this series off with an alteration of an existing alpha model to demonstrate the ease of using existing code in your projects and the plug-and-play modular feel that using the Algorithm Framework can give a user. Here is the modified code I restructured for my strategy.
class MyHistoricalReturnsAlphaModel(AlphaModel):
    '''Uses Historical returns to create insights.'''

    def __init__(self, *args, **kwargs):
        '''Initializes a new default instance of the HistoricalReturnsAlphaModel class.
        Args:
            lookback(int): Historical return lookback period
            resolution: The resolution of historical data'''
        self.lookback = kwargs['lookback'] if 'lookback' in kwargs else 1
        self.resolution = kwargs['resolution'] if 'resolution' in kwargs else Resolution.Daily
        self.predictionInterval = Time.Multiply(Extensions.ToTimeSpan(self.resolution), self.lookback)
        self.symbolDataBySymbol = {}
def Update(self, algorithm, data):
'''Updates this alpha model with the latest data from the algorithm.
This is called each time the algorithm receives data for subscribed securities
Args:
algorithm: The algorithm instance
data: The new data available
Returns:
The new insights generated'''
insights = []for symbol, symbolData in self.symbolDataBySymbol.items():
if symbolData.CanEmit:
direction = InsightDirection.Flat
magnitude = symbolData.Return
if magnitude > .75: direction = InsightDirection.Up
if magnitude < -.75: direction = InsightDirection.Down
insights.append(Insight.Price(symbol, self.predictionInterval, direction, magnitude, None))
return insights
def OnSecuritiesChanged(self, algorithm, changes):
'''Event fired each time the we add/remove securities from the data feed
Args:
algorithm: The algorithm instance that experienced the change in securities
changes: The security additions and removals from the algorithm'''
# clean up data for removed securities
for removed in changes.RemovedSecurities:
symbolData = self.symbolDataBySymbol.pop(removed.Symbol, None)
if symbolData is not None:
symbolData.RemoveConsolidators(algorithm)
# initialize data for added securities
symbols = [ x.Symbol for x in changes.AddedSecurities ]
history = algorithm.History(symbols, self.lookback, self.resolution)
if history.empty: return
tickers = history.index.levels[0]
for ticker in tickers:
symbol = SymbolCache.GetSymbol(ticker)
if symbol not in self.symbolDataBySymbol:
symbolData = SymbolData(symbol, self.lookback)
self.symbolDataBySymbol[symbol] = symbolData
symbolData.RegisterIndicators(algorithm, self.resolution)
symbolData.WarmUpIndicators(history.loc[ticker])
class SymbolData:
'''Contains data specific to a symbol required by this model'''
def __init__(self, symbol, lookback):
self.Symbol = symbol
self.ROCP = RateOfChange('{}.ROCP({})'.format(symbol, lookback), lookback)
self.Consolidator = None
self.previous = 0
def RegisterIndicators(self, algorithm, resolution):
self.Consolidator = algorithm.ResolveConsolidator(self.Symbol, resolution)
algorithm.RegisterIndicator(self.Symbol, self.ROCP, self.Consolidator)
def RemoveConsolidators(self, algorithm):
if self.Consolidator is not None:
algorithm.SubscriptionManager.RemoveConsolidator(self.Symbol, self.Consolidator)
def WarmUpIndicators(self, history):
for tuple in history.itertuples():
self.ROCP.Update(tuple.Index, tuple.close)
@property
def Return(self):
return float(self.ROCP.Current.Value)
@property
def CanEmit(self):
if self.previous == self.ROCP.Samples:
return False
self.previous = self.ROCP.Samples
return self.ROCP.IsReadyOne of the major changes is going from RateOfChange to RateOfPercentChange.
Full Code
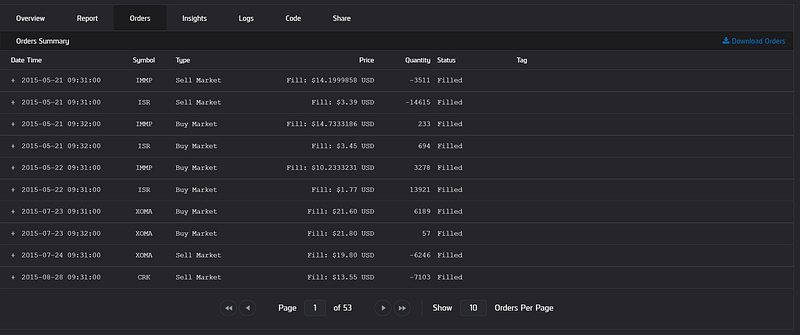
Here is the code for the whole strategy.
Now let’s see how it does on back-testing.
BACK-TESTING

Backtest №1
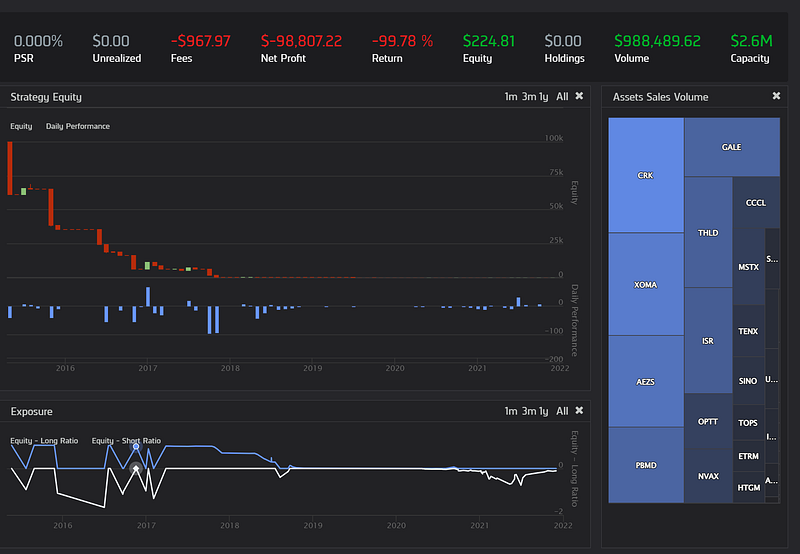
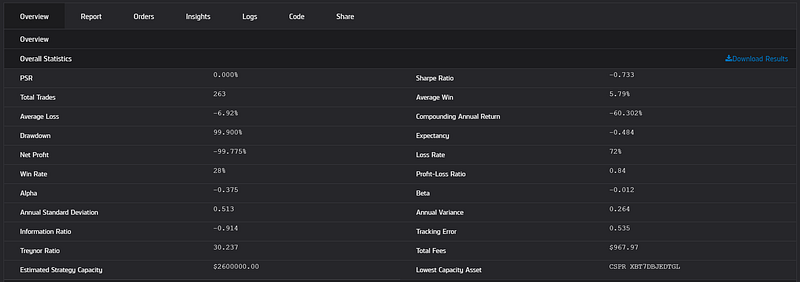
From the results of the first back-test, we can see that it was far from satisfactory. The strategy equity seems to diminish quickly with no signs of recovery. Looking at the Average Loss and the Average Win, as well as the Loss Rate and the Win Rate, we can see why it isn’t doing too good.
The Loss Rate is Larger than Win Rate and the Average Loss is larger than the Average Win. Giving the strategy a profit-loss ratio of 0.84. It is making a suitable number of trades at 263. The fees were low. Let’s reverse the signals to see if that can improve the overall performance.
From:
if magnitude > .75: direction = InsightDirection.Up
if magnitude < -.75: direction = InsightDirection.DownTo:
if magnitude > .75: direction = InsightDirection.Down
if magnitude < -.75: direction = InsightDirection.Up
Now let’s see what the second back-test brings.
Backtest №2
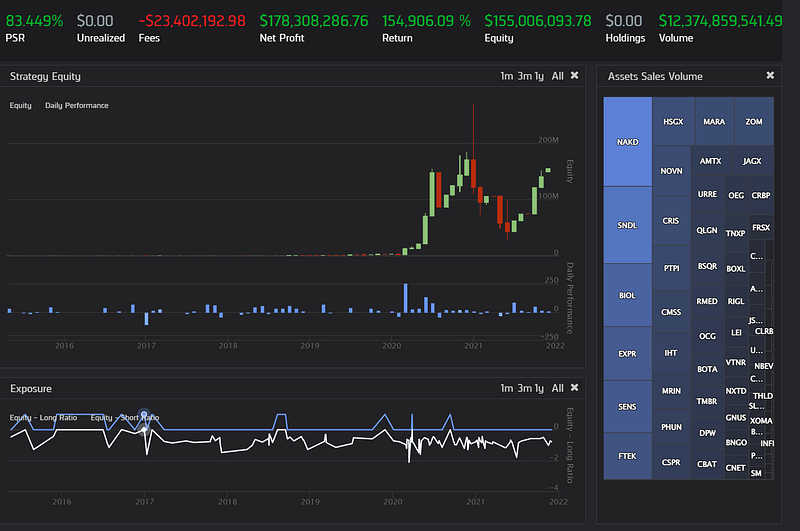
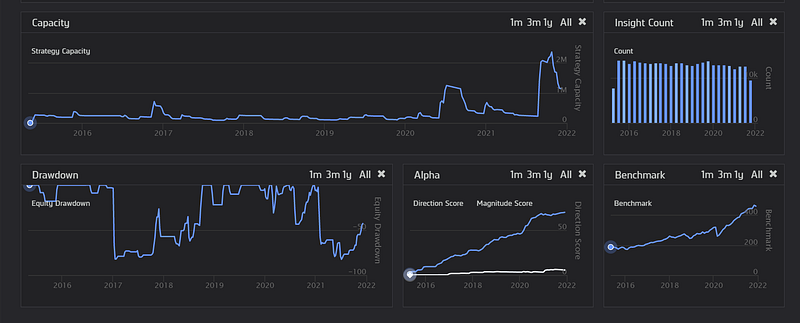
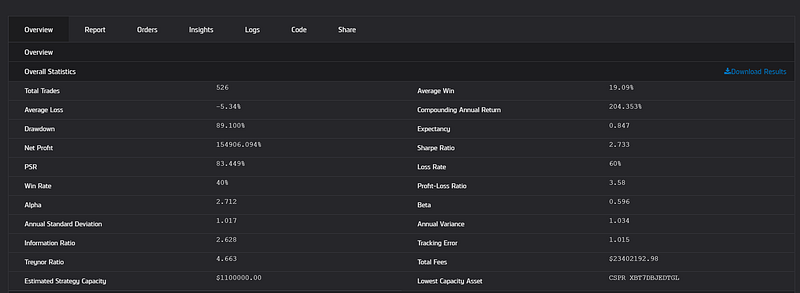
As you can see the performance was drastically better and now this strategy is showing some signs of potential. It is interesting how a quick reversal of signal logic can make such a powerful difference.
The hypothesis seems to be strong still because there was an effect that 14-day returns have on future prices, although it was the reverse of our original implementation that ended up being correlated at all.
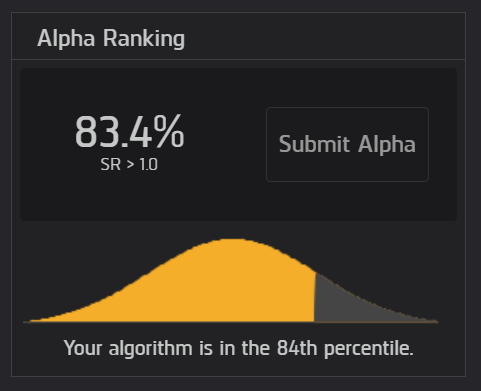
Also, this could have much bias still with the selection of the universe, as this strategy might not perform as well on a different universe. With a PSR above 80%, this strategy now should be scrutinized for its logic and decisions as well as sanity checked.
This is how I will leave this strategy for now and again I encourage anyone looking to better this strategy to post their results and work on the QuantConnect forum this algorithm is posted on.
FORWARD-TESTING

The next step would be to paper trade this strategy, sometimes called forward-testing. QuantConnect makes this process extremely easy and fun. Make sure to check out their docs for more information on this here:
DEPLOYMENT

If you have paper traded your strategy out and are convinced it is worth investing money, QuantConnect also makes it easy to do this by deploying the strategy live with a connected broker that integrates with them. You can learn more about this process here:
Again, I do NOT recommend trading any of my strategies live and none of this information is to be considered financial advice. This is merely for entertainment purposes.
Conclusion
While this strategy shows some promise, it is still too early to tell. The strategy really needs to be thoroughly tested, the risk may need to be added, an implementation may not be the best, and to be reviewed of errors, mistakes, and issues/bugs.
This is an incredibly simple strategy and a good one to start the series with because sometimes simple can really surprise you and it gives you a place to start. I really recommend QuantConnect's Bootcamp if you are interested in learning more on their platform. It is very interactive and a valuable resource, especially if you are new to Algorithmic Trading. They also have Video Series, a thriving community forum, and much more. There are many approaches to developing algorithms and I will go over other approaches in future Articles.
This does demonstrate how easy it is to immerse yourself in the Algorithmic Trading world. QuantConnect really has done an amazing job of bridging the gap for the average person to be involved in such an advanced and fast-moving industry. I plan to roll out more strategies on the QuantConnect platform as a part of this series.
On another note, if you notice anything wrong with my article or code, please respond and I will try to address the issue as fast as I can. Until next time, happy coding everyone!
More content at plainenglish.io. Sign up for our free weekly newsletter. Get exclusive access to writing opportunities and advice in our community Discord.