
AI Crypto Trading vs Buy & Hold
Can machine learning models beat a buy and hold strategy while trading cryptocurrencies?

Machine learning models are powerful applications that can be used for nearly anything you want. Personally, I have used many different types of machine learning models to predict financial outcomes of stocks and crypto. What I have yet to do is compare these outcomes to a simple buy and hold strategy. In the following experiment or project, I will train a classification ML model on technical analysis indicators in order to see if it can successfully determine if a cryptocurrency will be a buy or sell the next day.
I am aware of the mixed reception technical indicators and analysis have in the trading community. But in order to capture more data from cryptocurrency price movements for a classification model, I had to use them. Perhaps a ML model will be able to see a pattern in the technical indicators that a human could not.
Why classification and not time-series?
Usually when trying to predict or forecast price movements, you would use a time-series model. However, I decided to use classification models instead. Besides being a different approach to forecasting price movements, it also serves as a good way to see if certain changes in technical indicators lead to positive or negative price movements.
For example, given multiple technical indicators, if the RSI moved down 10%, MACD moved up 3%, etc., did those movements affect the next day’s price? And if it did, can a classification model pick up on those changes as well and predict the next day’s price position as a buy or sell?
It’s because of these reasons that I can see some validity in using classification models for price data. In the following sections, you’ll see how I built a backtest using ML classifications models and compared their performances to a buy and hold strategy.
Importing Libraries
import pandas as pd
import random
from ta import add_all_ta_features
from datetime import datetime, timedelta
import numpy as np
from sklearn.model_selection import train_test_split
from sklearn.metrics import classification_report
import plotly.express as px
from tqdm import tqdm
from eod_historical_data import get_eod_data
from sklearn.model_selection import GridSearchCV
Getting Price History
The first thing I had to do was retrieve the price history for any crypto needed. In order to do so, I utilized a simple API from EOD Historical Data also known as EOD HD. This API allows me to easily retrieve the prices from many available cryptocurrencies. Disclosure: I earn a small commission from any purchases made through the link above.
Below, I’m accessing my personal API key and using it within a custom function to retrieve crypto price data:
with open("../eodHistoricalData-API.txt", "r") as f:
api_key = f.read()Getting Technical Indicator Values
Next, I calculated the technical indicator values for the given cryptocurrency:
# Getting crypto price data
df = getCryptoPrice(api_key, ticker="BTC-USD", n_days=500)
# Getting Technical Indicator values
df = add_all_ta_features(
df,
open="Open",
high="High",
low="Low",
close="Close",
volume="Volume",
fillna=True
)Transforming the Data
Now that I have the price history and the technical indicator values, I can move to the next step of transforming the data to make it suitable for a classification ML model.
Explaining the transformData Function
With the function above, I was able to transform the given historical price and technical indicator data. The first thing I had to do was calculate the percent change between each day. For example, now instead of two points of data showing a change from 10 to 11, it will just be one point of data showing a 10% increase. This way each line of data can be independent from one another which makes it compatible for classification ML models. I also shifted the data ahead by one day in order to compensate for the indicators showing any lookahead bias.
Next, I dropped any predominantly NaN rows and columns. Afterwards, I had to create the class values (decision) from which the model can make a trade decision. This is done by calculating the percent change in the next day and if it was positive, then the decision would be a buy represented as the number 1. If it was negative, then it would be a 0 which means to do nothing and exit the current position. These numbers will be used in the backtest later on.
The last few steps in the function take care of any remaining NaN values.
Balancing the Data
Another important step while handling a classification model is to make sure each class is represented equally. We can’t have 1 or 0 overrepresented in the dataset.
With this function I am able to rebalance the class values (0 and 1) by retrieving a set number of the latest values. Now each class will have an equal representation when they are fitted to the various classification models.
Training Classification Models
Now the fun part begins where I can train this dataset to numerous classification models. The models I used are all available from the sklearn library.
First, I need to split the data into training and testing sets:
X = n_df.drop('decision', axis=1)y = n_df['decision']X_train, X_test, y_train, y_test = train_test_split(
X, y, test_size=0.20
)And create a baseline from which I can use to determine if a classification ML model is better than randomly guessing:
# Random predictions
ran_pred = random.choices([1,0], k=len(y_test))
# Classification report
report = classification_report(y_test, ran_pred)Classification Reports
The classification report will show various evaluation metrics. As a rule of thumb for this experiment, observe the F1 score for accuracy — the closer to 1 the better.
In order to quickly evaluate the many classification models available, I used a simple loop to print out each classification report for the models available:
Upon initial observation, the best classification model appears to be the boosting algorithms. However, this result could be changed with some hyperparameter tuning or even a change in the training size. For now, let’s move on to the backtesting portion where I’ll backtest each model and evaluate their performance while trading a cryptocurrency such as Bitcoin.
Backtesting Each Model
Once I have quickly tested out each model on the given dataset, I can move forward with the backtesting phase of the project. Now there are two ways from which I can backtest these classification models:
- Train each model once during the backtest. Make predictions and not consider new data as the backtest progressed. This option would be easier for hyperparameter tuning since you would only need to tune each model once.
- Train each model everyday during the backtest. Make predictions while considering the new data from the previous day. This option would basically deny any hyperparameter tuning because it would need to occur everyday during the backtest which is possible but it would be extremely time consuming.
Knowing these approaches to backtesting, I chose to go with option 2. To do so, I created two functions: one that fits each classification model and returns the fitted models and another that backtests the resulting fitted models.
Explaining the Backtesting Functions
In the fitModels function, I provided an option for some hyperparameter tuning while training each model. By default, the tuning option does not happen. This function provides each model with their default parameters minus some set random states. After each model is fitted to the provided dataset, they are then stored in a dictionary to be accessed during the following backtesting function.
In the backtestModels function, I consolidated the previous steps into one sequence — from grabbing the data from the API, transforming and balancing it, training it on a specific number of days, then making a prediction on the final day. These predictions, along with the random predictions and buy & hold strategy, are backtested using the log returns and cumulative sum.
Running the Backtest Functions
# Experimenting with different training sizes
for i in range(500, 2500, 500):

    # Backtest performance
    performance = backtestModels("BTC-USD", 365, i, api_key)
# Visualizing results
fig = px.line(
performance,
x=performance.index,
y=performance.columns,
title=f'Performance of Each ML Model (Training Size={i})',
labels={"value": "Portfolio Balance",
"ds": "Date"}
)fig.show()During the backtests, I decided to experiment with various training sizes to see if increasing it would show any significant changes. Perhaps the training sizes will affect the fitting of the models to the data in regards to overfitting or underfitting.
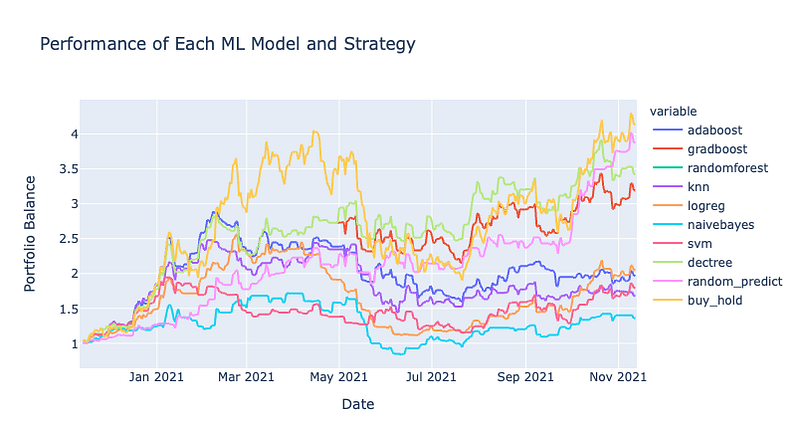
After each backtest has been performed, I visualized the performance of each backtest with the various training sizes to see the results to finally see if ML trading can beat out a buy & hold strategy…
Backtest Results
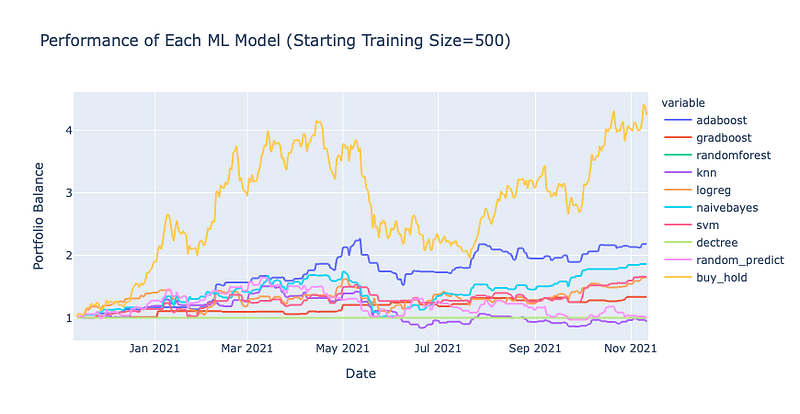
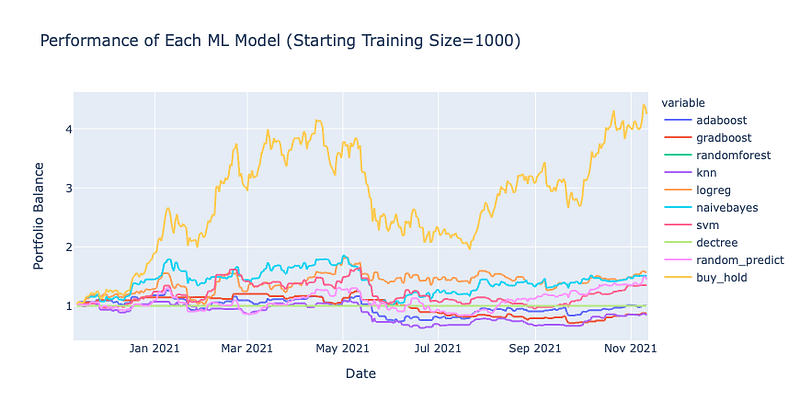
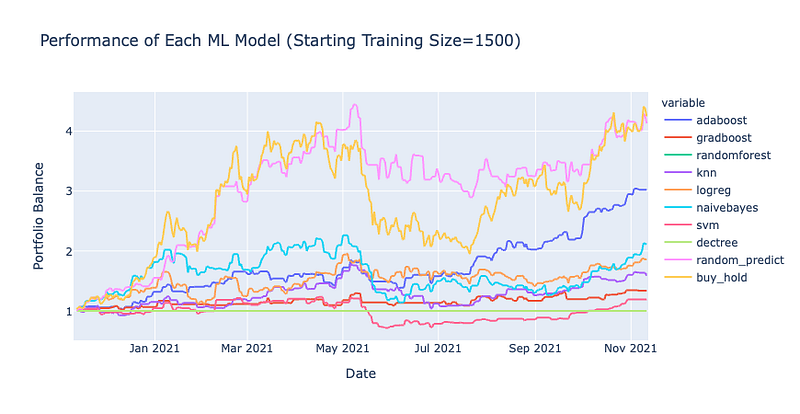
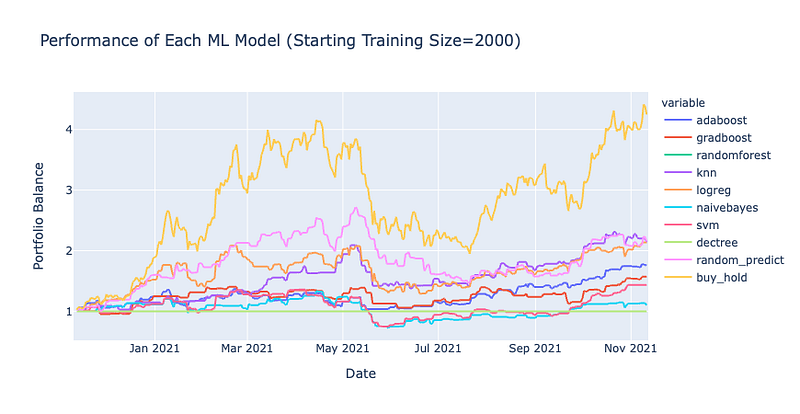
The results here are very interesting! In every backtest, the buy and hold strategy outperformed each one of the classification models. In one instance, even random predictions seemed to out perform both models and the buy & hold strategy however since it was random its consistency cannot be relied upon as you can see in the other backtests. Only the Adaboost classifier seems to show some promise at times but even then, the inherent random nature of the classifier combined with the rebalancing makes its performance doubtful. Also, I cannot see a noticeable difference when using different training sizes but maybe I just need an even larger dataset.
Improving Results with One Change
One way I’ve found to improve the backtest results is to increase the shifting of days by one, two, or three in the code of the transformData function — see below:
new_df['decision']= df['Open'].pct_change(
        days
    ).shift(
        days + 1 # Increasing shift of decision
    ).apply(
        lambda x: x>0
    ).astype(float)
This change drastically improves each ML model even with smaller training sizes:
Here you’ll see some significant improvements with the GradientBoost and Decision Tree models. They are pretty close to matching the Buy & Hold returns! But, still not quite able to beat them.
Closing Thoughts
After going through this process and backtesting each model, it’s probably certain in this instance that no ML model can beat the simple strategy of just buying and holding a cryptocurrency such as Bitcoin. I would have never thought this would be the case. The one advantage that I can see from using ML trading is that their portfolio performances are less volatile than buying and holding.
Other cryptocurrencies may fare differently and you are free to check out my code in the Github repo below to try it out yourself. Perhaps you may be able to find a better outcome than I have!