
Advanced Plotting in Python’s Sympy
Your Daily Dose of Scientific Python

When working with Python’s computer algebra package sympy, simple plots can easily be created with basic functions like plot. However, documentation on more advanced plotting is rather skim. But since sympy uses plotting power horses like matplotlib or Bokeh as backends, it can do a lot more! This article gives you an introduction and a taste of what it can do.
First of all, you need to install an add-on for the advanced plotting functionalities. Just submit
pip install sympy_plot_backends[all]in the console, and you are ready to go.
A First Example
Let’s plot a very simple function, 𝑓(𝑥)=1/𝑥 from -1 to 1. Obviously, there is a pole at 𝑥=0, and that actually makes the plotting cumbersome. Normally, it would look like this:
Then, in your Jupyter notebook, after importing sympy, also import the sympy plotting backends (spb):
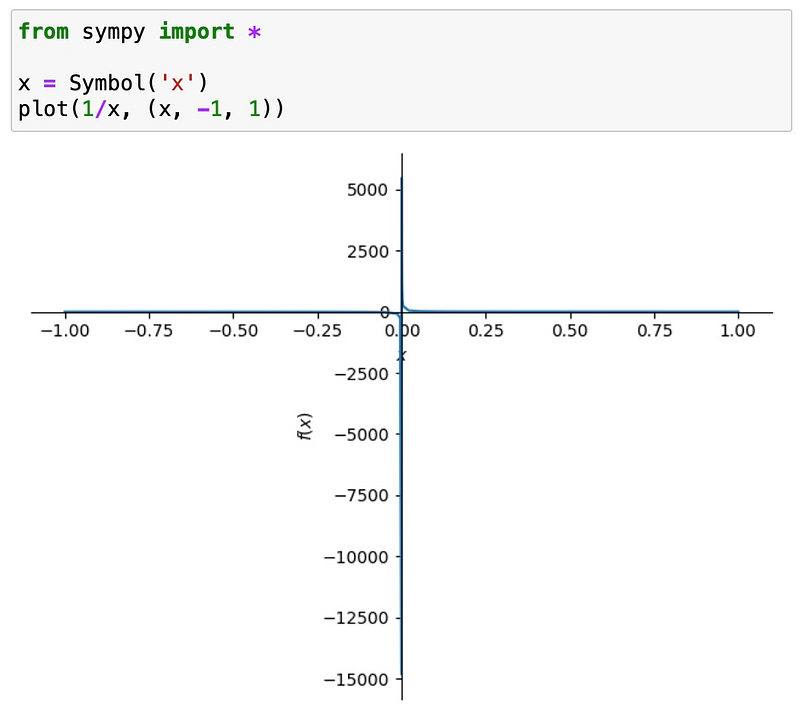
Wow it that ugly. And normally there is no quick way to make it better. But with the addon we have just installed, it’s totally easy. Just import the sympy plotting backends (spb) after importing sympy:
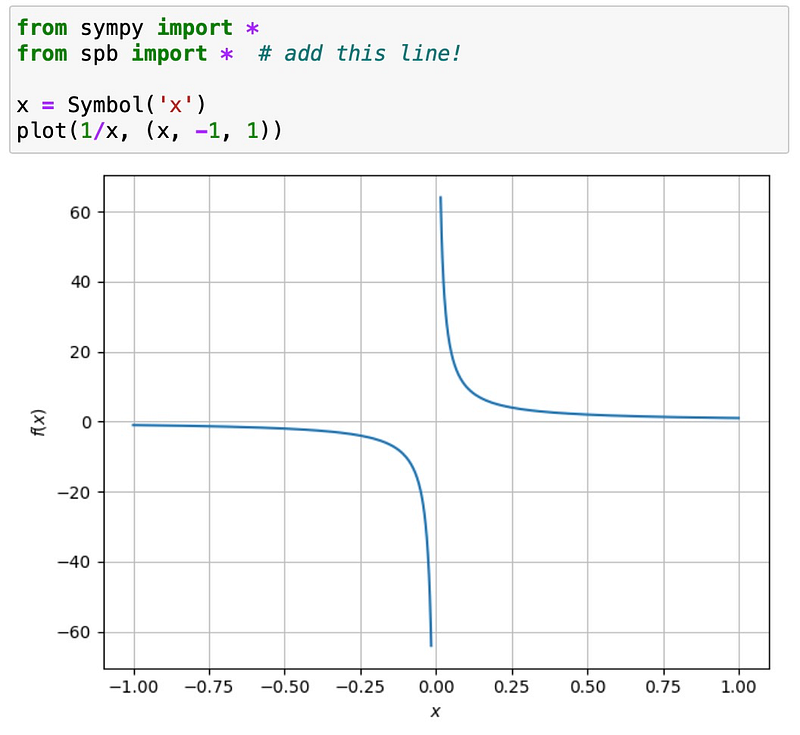
Much better, isn’t it? Well, that is just the beginning!
Working with Discontinuities
Consider the gamma function, which interpolates the factorial. As you probably know, the gamma function has poles for negative integer arguments. If we naively plot it, we get the following:
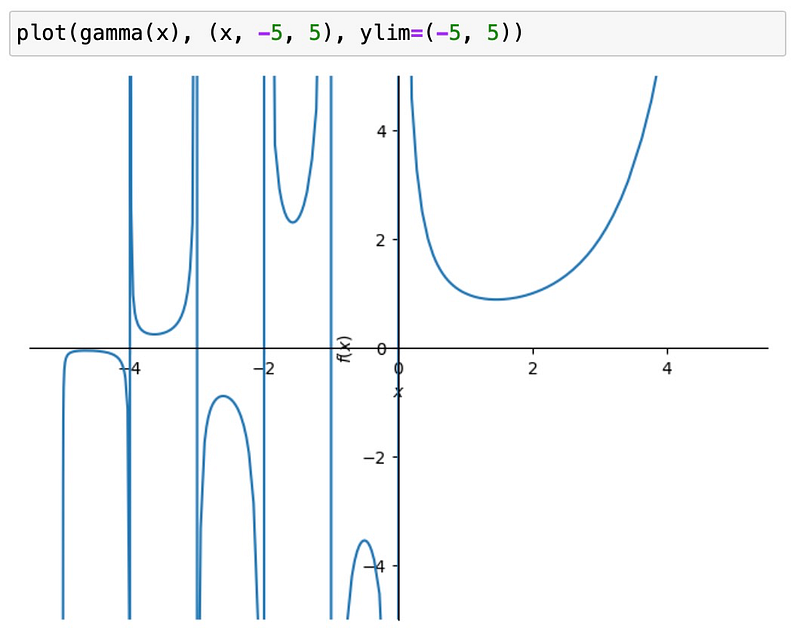
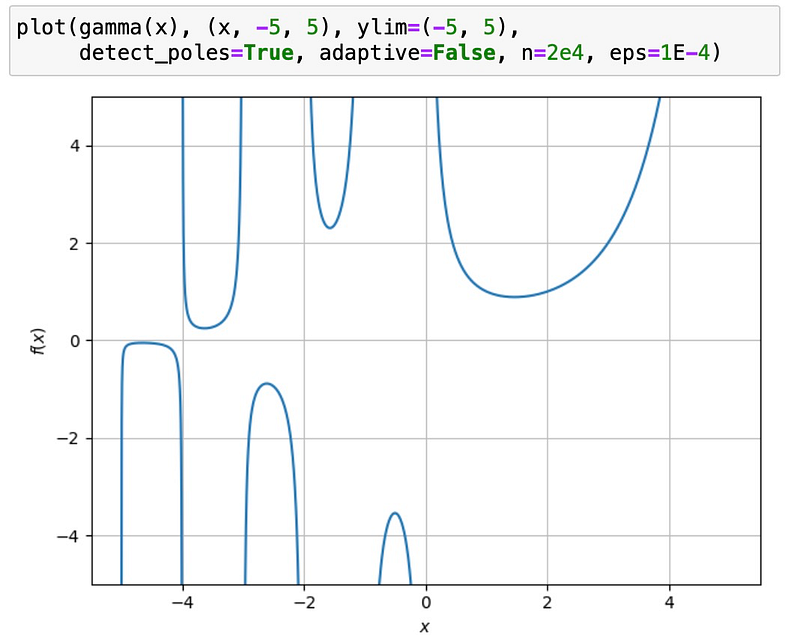
The standard plotting function connects points on the left side of poles with points on the side. But this is obviously not true. The spb add-on has a detector for discontinuities, which improves on that. Switch it on with the detect_poles option, turn off the adaptive option, and play with the hyper-parameters eps and n to optimize visual results:
The pole detector also works with finite discontinuities, like the step function. Normally, it looks like
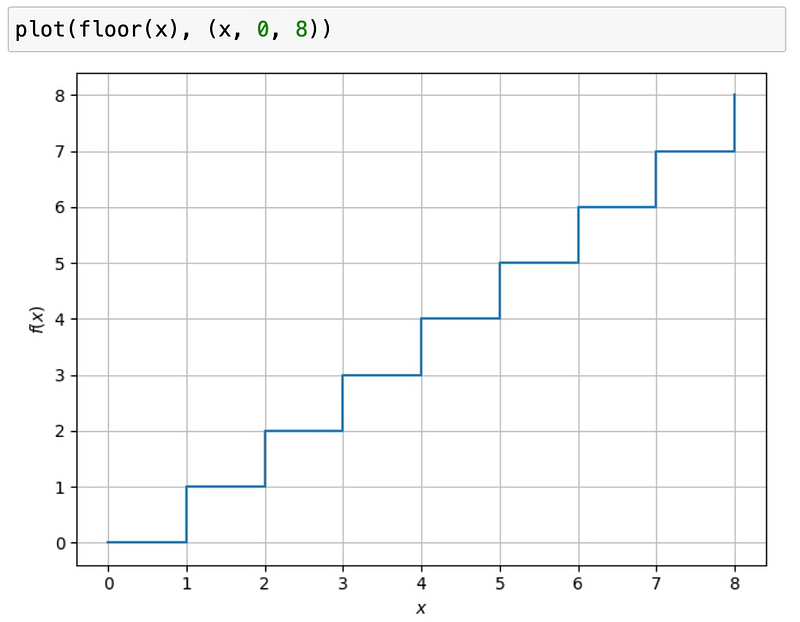
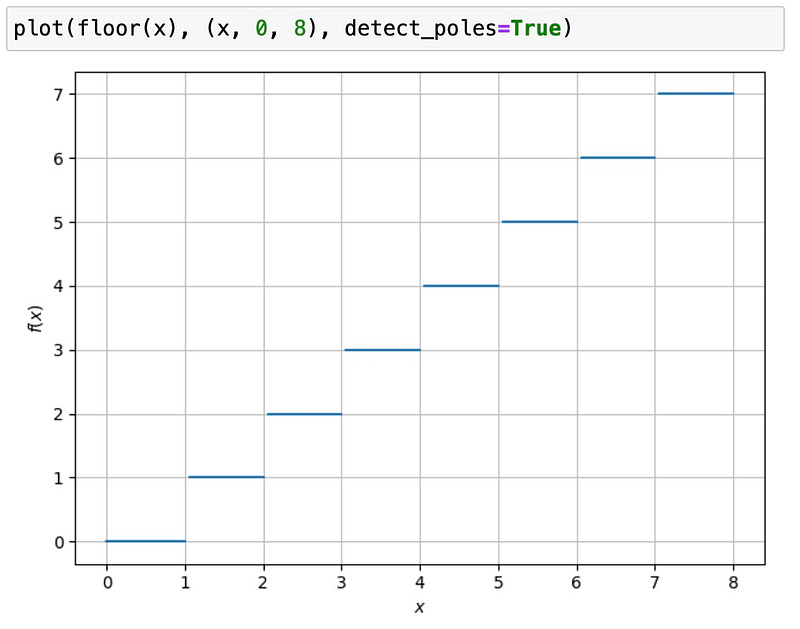
But the vertical lines at the integer values are artifacts. The pole detector removes that:
Passing Arguments to the Backend for Full Control
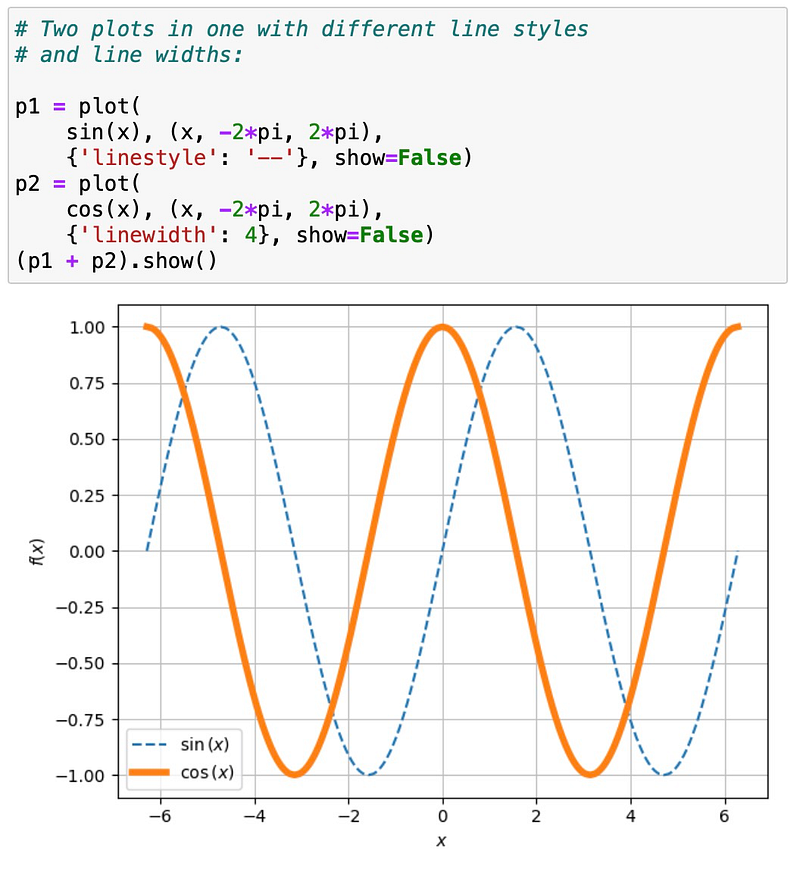
In pure sympy, the plot function has only a very limited set of options. For example, you can set the line color, but not the line style (like dashed). There is no way to pass further arguments down to the plotting backend. With the sbpaddon active, we can!
For instance, here is how we can pass the linestyle or linewidth option to matplotlib, which is the default backend:
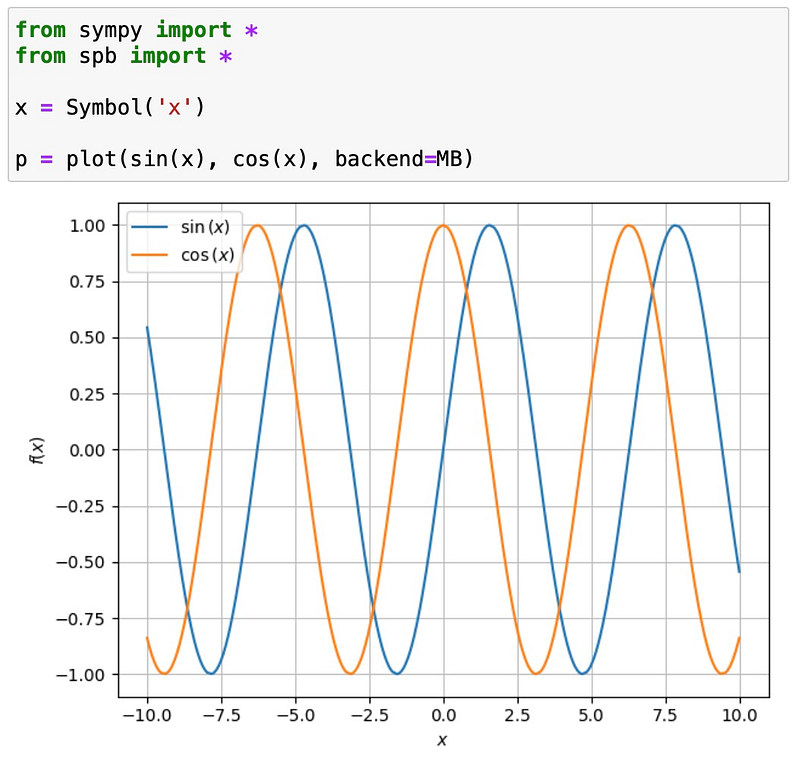
Using Different Backends, Interactivity Included
Three different 2D backends are available. The default one is matplotlib. You can specify the backend by setting the backend argument. Allowed values are
MBfor matplotlibBBfor BokehPBfor Plotly
For many options, the detailed backend doesn’t matter. But if you pass down options to the backend, it does matter, because the option syntax is different between backends.
For example, with matplotlib we get a static plot:
Doing the same plot with Bokeh backend gives us interactivity, like zooming, in addition:
Special Plots
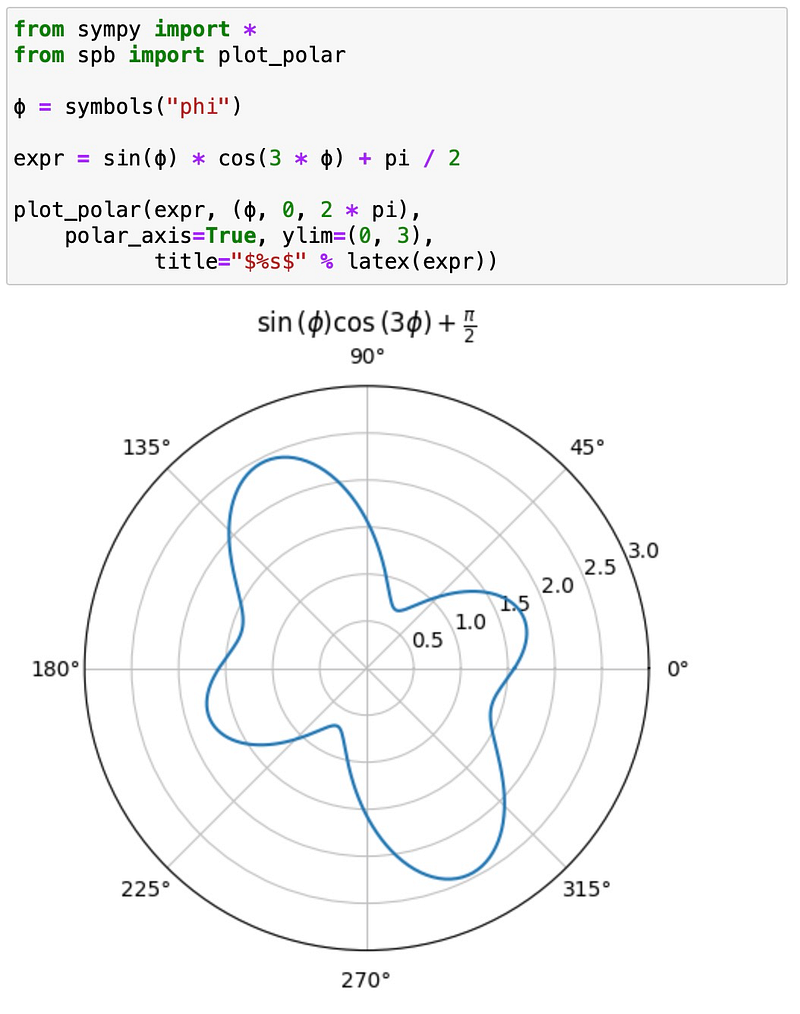
So far, we have only played with standard 2D plots. But there is much more. For example, you can easily do polar plots using plot_polar:
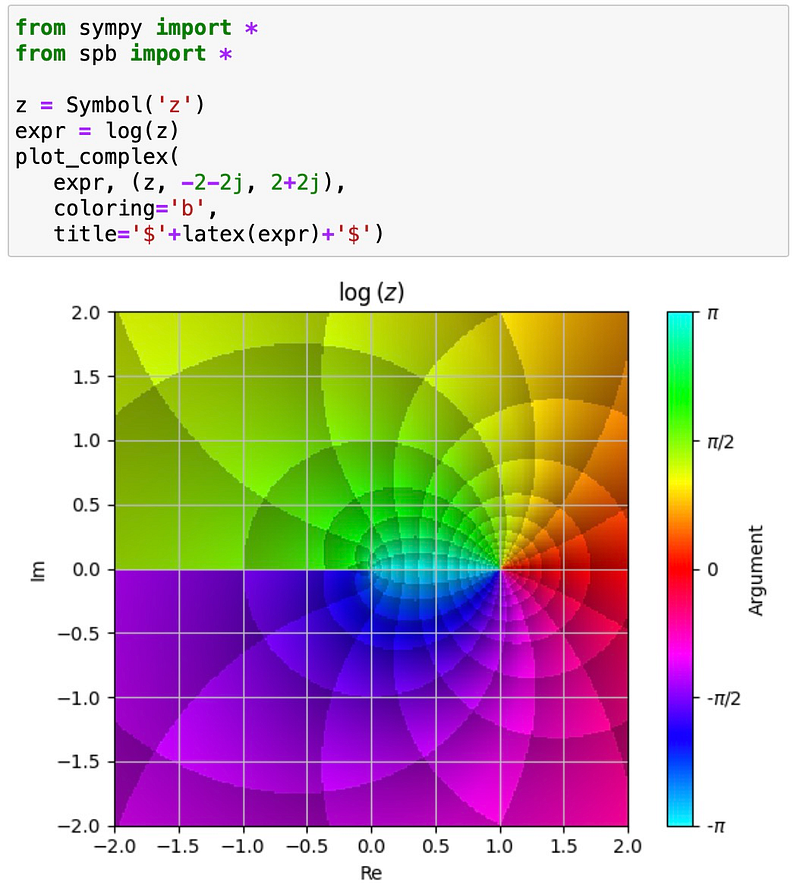
Complex functions can also be visualized easily, using plot_complex. For example, here is a visualization of the complex logarithm:
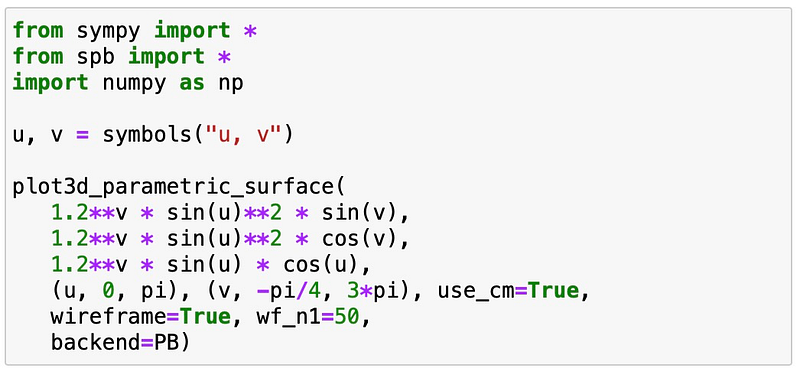
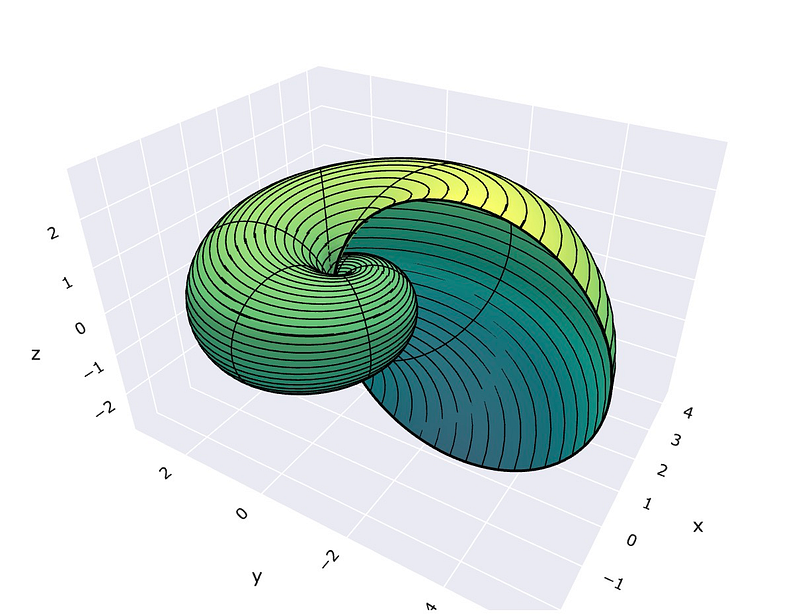
And as a final teaser, sympy plotting also offers a lot in 3D. For example, look at this beautiful nautilus:
Still not convinced? Well, then stay tuned. There is more to come. :-)


