
Advanced Pattern Recognition for Trading
Creating a Pattern Recognition Trading Strategy in TradingView

Pattern recognition is always an exciting field when it comes to financial research and trading. This article discusses a patterns-based strategy applied on a famous technical indicator.
For a detailed and thorough collection of trend following trading strategies, you can check out my book. The book features a huge number of classic and modern techniques as it dwelves into the realm of technical analysis with different trading strategies. The book comes with its own GitHub.
The 8 — 3 Pattern
Pattern can come in all shapes in forms, from price patterns to volume patterns and even timing patterns. The 8–3 is a simple pattern that relies on successive conditions on different variables to be realized. The following are the conditions for the 8–3 pattern:
- A buy pattern occurs after eight successive close prices where each close price is lower than the close price three periods ago.
- A sell pattern occurs after eight successive close prices where each close price is higher than the close price three periods ago.
The strategy takes the 8–3 a bit further and applies the conditions on the RSI with an extra step.
Creating and Coding the Strategy
The strategy has the following rules:
- For a long signal, the RSI must shape a 8–3 pattern with the last value below 30.
- For a short signal, the RSI must shape a 8–3 pattern with the last value above 70.
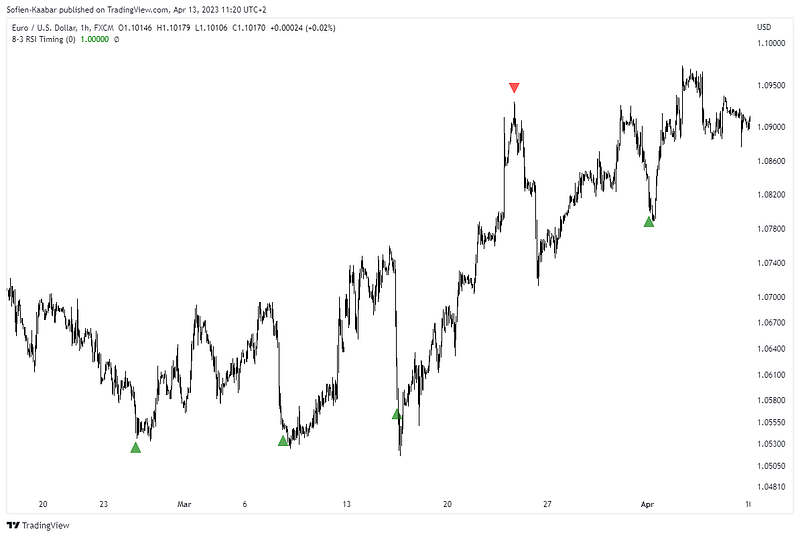
The following Figure shows the signal chart on EURUSD:
The code of the startegy on TradingView is as follows:
study("8-3 RSI Pattern", overlay = true)
transp = input(0)
Numbers = input(true)
SR = input(true)
Barcolor = input(true)
TD = rsi(close, 14) > rsi(close, 14)[3] ?nz(TD[1])+1:0
TS = rsi(close, 14) < rsi(close, 14)[3] ?nz(TS[1])+1:0
TDUp = TD - valuewhen(TD < TD[1], TD , 1 )
TDDn = TS - valuewhen(TS < TS[1], TS , 1 )
plotshape(TDDn==8 and rsi(close, 14) < 30?true:na, style = shape.triangleup, color = green, location = location.belowbar, size = size.small)
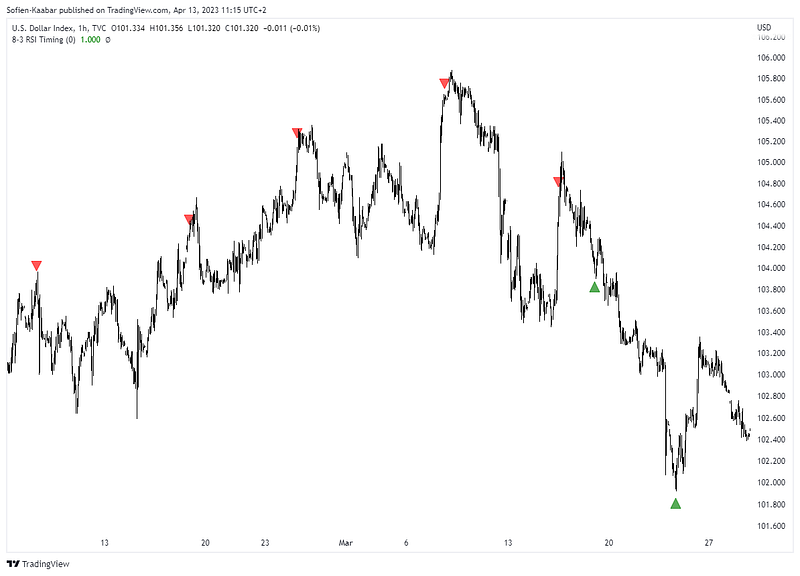
plotshape(TDUp==8 and rsi(close, 14) > 70?true:na, style = shape.triangledown, color = red, location = location.abovebar, size = size.small)The following Figure shows the signal chart on DXY:
If you want to see how to create all sorts of algorithms yourself, feel free to check out Lumiwealth. From algorithmic trading to blockchain and machine learning, they have hands-on detailed courses that I highly recommend.
Summary
To sum up, what I am trying to do is to simply contribute to the world of objective technical analysis which is promoting more transparent techniques and strategies that need to be back-tested before being implemented. This way, technical analysis will get rid of the bad reputation of being subjective and scientifically unfounded.
I recommend you always follow the the below steps whenever you come across a trading technique or strategy:
- Have a critical mindset and get rid of any emotions.
- Back-test it using real life simulation and conditions.
- If you find potential, try optimizing it and running a forward test.
- Always include transaction costs and any slippage simulation in your tests.
- Always include risk management and position sizing in your tests.
Finally, even after making sure of the above, stay careful and monitor the strategy because market dynamics may shift and make the strategy unprofitable.


