
Accessing company financials using the SEC Financial Statement Data Sets
This post is divided into two parts. The first part describes how to prepare SEC Financial Statement Data Sets for interpretation, which is covered in the second half.
Disclaimer: The information provided here is for informational purposes only and is not intended to be personal financial, investment, or other advice.
The SEC provides two options for public data access: the first is through the EDGAR API, for which the SEC reserves the right to limit request rates (fair access—a maximum request rate of 10 requests per second). The API approach is well explained in the articles Access Companies SEC Filings Using Python and Accessing company financials using the SEC EDGAR API. The second option is to use publicly available financial data sets that can be downloaded as zip files from here. They are updated on a quarterly basis. Data sets spanning from 2009 Q1 to 2023 Q4 are currently available for download.
The following data sets are available as tab-delimited text format files:
- SUB — Submission data set; fields relevant to the submission and the filing entity are included in the submission data set (one record for each XBRL submission), which is derived from the SEC’s EDGAR system and the filings that registrants make to the SEC.
- NUM — Number data set; consists of one row for each unique amount from each submission that is part of the SUB data set.
- TAG — Tag data set; contains defining information about individual tags, such as tag characteristics, taxonomy version information, and tag descriptions.
- PRE — Presentation data set: gives details on the manner in which the numbers and tags were shown in the main financial statements.
- readme.htm — an HTML file (a PDF version is available here) that describes the datasets, including table definitions and relationships.
We only consider SUB and NUM files for this article; of the two, the NUM file tends to be larger, with over 250 MB data per quarter; we consider only 2 years (a total of 8 quarters), but the idea can be extended beyond 2 years. Furthermore, the following steps were taken in order to decrease the duration required to populate DataFrames:
- Only load submissions (SUB) for a list of chosen tickers
- Only load Numbers (NUM) related to Forms 10-Q (quarterly) and 10-K data
The code is accessible as a Jupyter notebook on GitHub; the datasets are not included because you may obtain them directly from the SEC. It is assumed that you are familiar with the fundamentals of Python and pandas DataFrame.
Part 1 — Data Preparation
Python Libraries
With the exception of pandas, which is necessary for DataFrame, no external Python libraries are needed. The built-in modules, csv and json, are the other two necessary modules.
Import Libraries
# To read company tickers file json file
import json
# To access DataFrame
import pandas as pd
# To read files
import csv
Constants
# Data Path
DATA_PATH = 'data'

# Constant for Form 10-K
FORM_10K = '10-K'

# Constant for Form 10-Q
FORM_10Q = '10-Q'

# Form we are interested, should be one of those constants defined above
FORM = FORM_10K

# List of Submissions fields we are interested in
SUB_FIELDS = ['adsh','cik','name','sic','countryba','fye','form','period','fy','fp','filed','accepted']

# Listy of Numbers fields we are interested in
NUM_FIELDS = ['adsh','tag','version','ddate','qtrs','uom','value']

# Symbols we are interested
SYMBOLS = ['GOOG','NVDA','ADBE']#'MSFT','AMZN','TSLA','WMT']
DATA_PATH — path to the datasets; this is relative to the Jupyter notebook
FORM_10K, FORM_10Q — represent Form 10-K and 10-Q as they appear in the SUB file
FORM — the current form we are processing; the impact is that when it is set to 10-K, DataFrames will only contain records relevant to Form 10-K
SUB_FIELDS, NUM_FIELDS — list of Submission and Numbers fields we need
SYMBOLS — list of ticker symbols; as stated previously, only the companies with ticker symbols in this list are taken into consideration
Map CIKs to Tickers
A Central Index Key (CIK) is a ten-digit number that the SEC assigns to each registrant that files a filing in the SUB dataset. The SEC also provides a json file that maps CIK to the Ticker symbol. Instead of downloading the file, you can request online access to the json file; the code below uses the downloaded approach. See Access Companies SEC Filings Using Python for instructions on how to access via a request call.
def get_company_tickers() -> pd.DataFrame:
    '''
    Returns a DataFrame consists of CIK, ticker symbols

    Returns:
    pd.DataFrame: a DataFrame consists of CIK, ticker symbols or None for any errors
    '''
    # Specify the full path to load JSON data
    file_name = f'{DATA_PATH}/company_tickers.json'

    # DF to return
    df = pd.DataFrame()
    try:
        # Open the file in read mode
        with open(file_name, 'r') as file:
            # Use json.load() to parse the JSON data from the file
            df = pd.json_normalize(pd.json_normalize(json.load(file), max_level=0).to_numpy()[0])
            df.set_index('ticker',inplace=True)
    except FileNotFoundError:
        print(f"File '{file_name}' not found.")
    except json.JSONDecodeError as e:
        print(f"Error decoding JSON data: {e}")
    except Exception as e:
        print(f"An error occurred: {e}")
    return df
Let’s call the method to get mappings:
# Get ticker, cik mappings
tickers_cik = get_company_tickers()
tickers_cik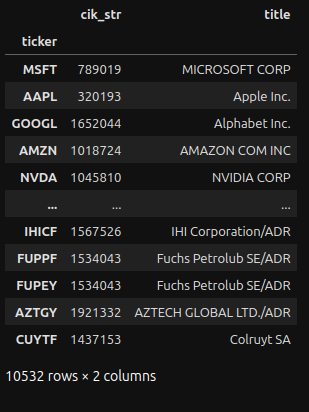
Create another dictionary that only holds mappings relevant to the tickers specified in the SYMBOLS constant:
# Maps CIK -> ticker
cik_ticker_dict = {}
for symbol in SYMBOLS:
    # Only interested in CIK
    cik_ticker_dict[tickers_cik.loc[symbol]['cik_str']] = symbol
cik_ticker_dict
The output:
{1652044: 'GOOG', 1045810: 'NVDA', 796343: 'ADBE'}Load SUB Data Set
def load_sub(year:int, qtr:int) -> pd.DataFrame:
    '''
    Returns the submissions as a DataFrame object

    Parameters:
    year (int): the year of the submission
    qtr (int): the quarter, valid values are 1 to 4

    Returns:
    pd.DataFrame: submissions for given year and quarter as a DataFrame. FileNotFound exception
    is thron if the submission file is not found for given parameters
    '''
    # Holds dictionaries to add to the DF
    records = []

    #1 Construct the filename
    fname = f'{DATA_PATH}/{year}q{qtr}/sub.txt'

    # Open file
    with open(fname, 'r', encoding='utf8') as file_obj:
        #2 Save the heading as a list
        heading = next(file_obj).split()

        #3 Create reader object
        reader_obj = csv.reader(file_obj, delimiter='\t')

        # Iterate over each row in the csv file
        for row in reader_obj:
            # Only interested in symbols specified at the beginning
            # Assume second item in the row is the CIK; this is to avoid creating a row_dict item unnecessarily
            #4 Check whether CIK is belongs to one of our stocks
            if int(row[1]) not in cik_ticker_dict: continue
            # zip heading and row to create a dictionary
            row_dict = dict(zip(heading, row))
            #5 Only interested in forms specified in FORM constant
            if row_dict['form'] != FORM: continue
            # Filter columns we want to add
            filtered_dict = {}
            #6 Only interested in SUB_FIELDS
            for field in SUB_FIELDS:
                filtered_dict[field] = row_dict[field]
            records.append(filtered_dict)
    #7 Create a DF from a list of records
    df = pd.DataFrame(records)
    df['dataset'] = f'{year}q{qtr}'
    return df
Highlights:
- #1 — for a submission, the year and the quarter are used to create the filename
- #2 — save the first line as the heading
- #3 — create a reader object with tab as a delimiter
- #4 — CIK (the second field) is used to determine whether the CIK of our ticker symbol and the CIK in the current row match
- #5 — filter out any forms which don’t match with the FORM constant, for example, 8-K, etc.
- #6 — fields not included in the SUB_FIELDS constant are filtered out
- #7 — create a DF from a list of records and add a column with the dataset name; this is the only custom field. The names of the other fields are taken from the SUB dataset
Create SUB DataFrame
To generate a DF for a period, loop through the years and quarters, then concatenate them to produce a single Submissions DF.
# Collect DataFrames for each qtr
frames = []

# Loads data for years and quarters
for year in [2022, 2023]:
    for q in range(1,5):
        frames.append(load_sub(year,q))

# Join all the resulting DFs
sub_df = pd.concat(frames)
sub_df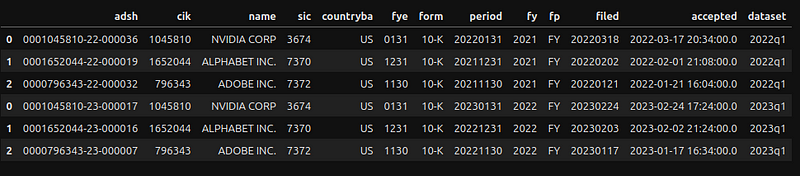
Add an index and align fields according to the SUB table definitions.
# Use adsh as the index
sub_df.set_index('adsh', inplace=True)

# Comply with the field format as specified in the readme.htm in the download

# CIK and sic are numeric fields
for key in ['cik','sic']:
    sub_df[key] = pd.to_numeric(sub_df[key], errors='coerce')

# Convert to date time format
for key in ['period','filed','accepted']:
    sub_df[key] = pd.to_datetime(sub_df[key])
sub_df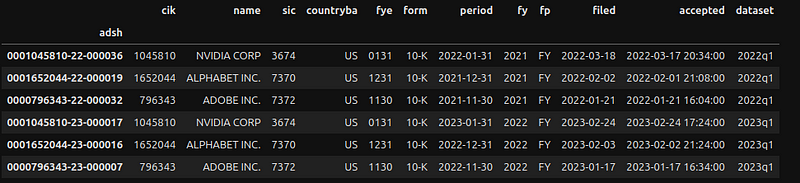
Load NUM Data Set
def load_num(year:int, qtr:int) -> pd.DataFrame:
    '''
    Returns the numbers as a DataFrame object

    Parameters:
    year (int): the year for the numbers
    qtr (int): the quarter, valid values are 1 to 4

    Returns:
    pd.DataFrame: numbers for given year and quarter as DataFrame. FileNotFound exception
    is thron if the numbers file is not found for given parameters
    '''
    # Holds dictionaries to add to the DF
    records = []

    # Construct the filename
    fname = f'{DATA_PATH}/{year}q{qtr}/num.txt'

    # Open file
    with open(fname, 'r', encoding='utf8') as file_obj:
        # Save the heading as a list
        heading = next(file_obj).split()

        # Create reader object
        reader_obj = csv.reader(file_obj, delimiter='\t')

        # Iterate over each row in the csv file
        for row in reader_obj:
            # Only interested in rows with accession numbers (adsh) beloging to the symbols we are interested.
            #1 Assume the first item in the row is the adsh; this to avoid creating row_dict item unnecessarily
            if row[0] not in sub_df.index: continue
            # zip heading and row to create a dictionary
            row_dict = dict(zip(heading, row))
            # Filter columns we want to add
            filtered_dict = {}
            #2 Only interested in NUM_FIELDS
            for field in NUM_FIELDS:
                filtered_dict[field] = row_dict[field]
            records.append(filtered_dict)
            #3 Add a column to specify the fy for a number field - custom field
            filtered_dict['fy'] = sub_df.loc[row[0]]['fy']
    # Create a DF from a list of records
    df = pd.DataFrame(records)
    # Custom field - adds the dataset name
    df['dataset'] = f'{year}q{qtr}'
    return df
The process is comparable to importing a SUB data set. Let us focus solely on the variations:
- #1 — An Accession Number (adsh) that is not included in the SUB DF is ignored. This implies that SUB DF needs to be established prior to calling this function
- #2 —fields not included in the NUM_FIELDS constant are filtered out
- #3 — add a custom column for the fiscal year (fy). The value for the column is from SUB DF
Create NUM DataFrame
The approach is identical to creating the SUB DF.
# Collect DataFrames for each qtr
frames = []
# Loads data for years and quarters
for year in [2022, 2023]:
    for q in range(1,5):
        frames.append(load_num(year,q))

# Join all the resulting DFs
num_df = pd.concat(frames)
num_df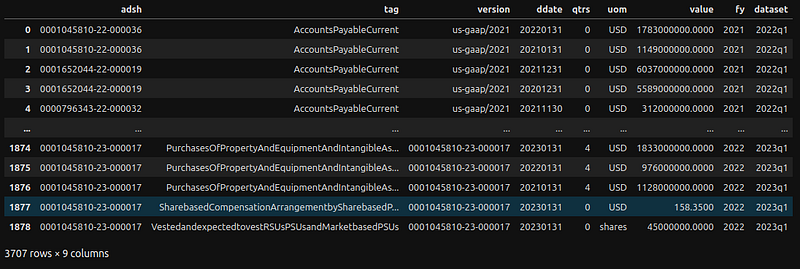
The second column (tag) is a unique identifier (name) for a tag in a particular taxonomy release. Align fields according to the NUM table definitions:
# Comply with the field format as specified in the readme.htm in the download

# Quarters and value are numeric fields
for key in ['qtrs', 'value']:
    num_df[key] = pd.to_numeric(num_df[key], errors='coerce')

# Convert to date time format
num_df['ddate'] = pd.to_datetime(num_df['ddate'])

num_df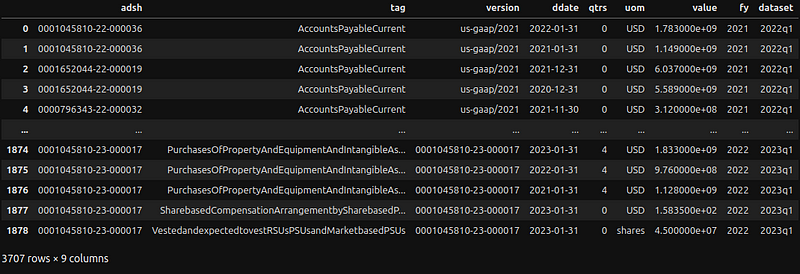
Both SUB and NUM data sets are ready for interpretation.
Part 2— Data Interpretation
Let’s create a utility method to get values for a given ticker, tag, and year.
def get_tag_values(symbol:str, tag:str, year:str=None) -> dict:
    '''
    Returns the values for given tag belonging to a symbol

    Parameters:
    symbol (str): ticket symbol must exist in the SYMBOLS constant
    tag (str): unique identifier (name) for a tag in a specific taxonomy release
    year (str): year for the values or defaults to all the years if not specified

    Returns:
    dict: with followng keys: symbol, CIK, tag and list of values associated with the tag or
    or a skeleton dictionary if symbol does not exist in the SYMBOLS constant
    '''
    # Dictionary to return
    result = {'symbol': symbol, tag: []}

    #1 Get the CIK for given symbol
    cik = str(get_cik(symbol))

    #2 Return the empty dictionary if symbol is not found
    if not cik: return result

    #3 Pad with zero for CIK - as per specification
    result['cik'] = cik.zfill(10)

    #4 Only interested in qtr 1 and 0 for 10-Q and 4 and 0 for 10-K
    qtr = 1 if FORM == FORM_10Q else 4

    if year is None:
        df = num_df.query('adsh.str.contains(@cik) and tag == @tag and qtrs in (@qtr,0)')
    else:
        df = num_df.query('adsh.str.contains(@cik) and tag == @tag and qtrs in (@qtr,0) and fy == @year')

    if df.empty: return result

    # Save unique dates
    unique_dates = df['ddate'].unique()
    #5 Loop through using unique dates, only take the value from the latest data set
    for date in sorted(unique_dates):
        #6 Only take the first item
        series = df.query('ddate == @date').sort_values(by=['dataset'], ascending=False).iloc[0]
        dict = series.to_dict()
        #7 Construct an item to add to the tag
        tag_item = {
            'fiscalDateEnding': dict['ddate'].strftime('%Y-%m-%d'),
            'reportedDate': sub_df.loc[dict['adsh']]['filed'].strftime('%Y-%m-%d'),
            'value': dict['value']
        }
        #8 Add to the tag array
        result[tag].append(tag_item)
    return result
Highlights:
- #1 — call a utility method (check notebook on Github for the code) to get CIK for given symbol
- #2 — check for non existence CIK for given symbol. This will happen for a symbol not found in the SYMBOLS constant
- #3 — fill with zero to make it a 10 digit number
- #4 — for Form 10-Q, only interested in quarter values of 1 (count of the number of quarters represented by the data) and 0 (a point-in-time value). For 10-K, it will be 4 and 0
- #5, #6 — a tag value may appear multiple times. In that case, we will loop through the latest value. Let’s explain this with an example:
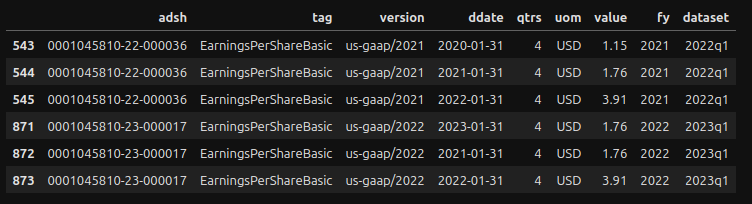
The values in row 544 and row 545 represent the Basic EPS for 2021–01–31 and 2022–01–31, respectively. These values are found in the 2022 Q1 data set. Additionally, you can see that these values are also found in the 2023 Q1 data set (rows 872 and 873). In light of these circumstances, the logic in row #5 above guarantees that only a single value for the latest data set is returned.
- #7 — create a tag item with the following information: the value, the reported date (from SUB DF), and the fiscal ending date
- #8 — add the tag item to the tag array
Let us find the Basic EPS for NVDA symbol:
get_tag_values('NVDA','EarningsPerShareBasic')As we have not indicated a year, the method returns all EPS it finds in the data set (in our example, utilizing data sets for 2022 and 2023).
{'symbol': 'NVDA',
 'EarningsPerShareBasic': [{'fiscalDateEnding': '2020-01-31',
   'reportedDate': '2022-03-18',
   'value': 1.15},
  {'fiscalDateEnding': '2021-01-31',
   'reportedDate': '2023-02-24',
   'value': 1.76},
  {'fiscalDateEnding': '2022-01-31',
   'reportedDate': '2023-02-24',
   'value': 3.91},
  {'fiscalDateEnding': '2023-01-31',
   'reportedDate': '2023-02-24',
   'value': 1.76}],
 'cik': '0001045810'}
Let’s add a year to the method to return Basic EPS for 2021:
get_tag_values('NVDA','EarningsPerShareBasic', '2021'){'symbol': 'NVDA',
'EarningsPerShareBasic': [{'fiscalDateEnding': '2020-01-31',
'reportedDate': '2022-03-18',
'value': 1.15},
{'fiscalDateEnding': '2021-01-31',
'reportedDate': '2022-03-18',
'value': 1.76},
{'fiscalDateEnding': '2022-01-31',
'reportedDate': '2022-03-18',
'value': 3.91}],
'cik': '0001045810'}Because the previous technique depends on the correct tag name for returning values, the following method can help find tag names.
def get_nums_for_tag(symbol:str, tag:str, year:str=None) -> pd.DataFrame:
    '''
    Returns the numbers for a symbol, tag and year (optional)

    Parameters:
    symbol (str): ticket symbol must exist in SYMBOLS constant
    tag (str): unique identifier (name) for a tag in a specific taxonomy release
    year (str): year for the values or defaults to all the years if not specified

    Returns:
    pd.DataFrame: a DF with numbers for given symbol, tag and year (optional); empty DF is
    returned if symbols is not found in the SYMBOLS constant
    '''
    # Get the CIK for given symbol
    cik = get_cik(symbol)

    # Return empty data frame if symbol is not found
    if not cik: return pd.DataFrame()
    cik = str(cik).zfill(10)
    if year is None:
        return num_df.query('adsh.str.contains(@cik) and tag.str.contains(@tag)')
    return num_df.query('adsh.str.contains(@cik) and tag.str.contains(@tag) and fy == @year')
Suppose you wish to find out the tag names that have “EarningsPerShare” in them for NVDA.
get_nums_for_tag('NVDA', 'EarningsPerShare')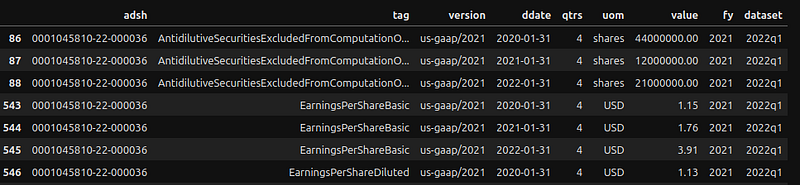
The tag name for row 86 is ‘AntidilutiveSecuritiesExcludedFromComputationOfEarningsPerShareAmount’
The definition for tag names can be found in the TAG data set, which we didn’t use in this article. Alternately, you can also visit the online taxonomy viewer.
Another useful method is to look up the submissions for a symbol.
def get_subs_for_symbol(symbol:str, year:str=None) -> pd.DataFrame:
    '''
    Returns the submissions for a symbol

    Parameters:
    symbol (str): ticket symbol must exist in SYMBOLS constant
    year (str): year for the values or defaults to all the years if not specified

    Returns:
    pd.DataFrame: a DF with submissions for given symbol and year (optional); empty DF is
    returned if symbols is not found in the SYMBOLS constant
    '''
    # Get the CIK for given symbol
    cik = get_cik(symbol)

    # Return empty data frame if symbol is not found
    if not cik: return pd.DataFrame()
    if year is None: return sub_df.query('cik == @cik')
    return sub_df.query('cik == @cik and fy == @year')
To find out submissions for NVDA:
get_subs_for_symbol('NVDA')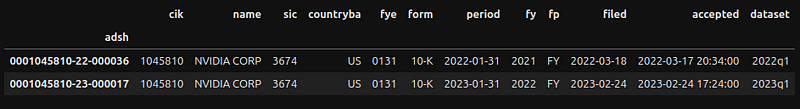
Conclusion
This article describes an alternative approach to using financial data sets made available to the public by the SEC. This approach eliminates rate request limits with the EDGAR API, but at the expense of adding complexity with the data loading. Using a persistent store fronted by an API is definitely more effective and better than the current design, which loads data for each invocation. This will be for another project later.
One thing to keep in mind is that a data set is a snapshot of data at a specific point in time. Subsequent reporting periods will reflect changes made for the relevant period. Let me explain this with GOOG data for tags related to shares.
Basic EPS for GOOG via get_tag_values method will return the following values:
{'symbol': 'GOOG',
 'EarningsPerShareBasic': [{'fiscalDateEnding': '2019-12-31',
   'reportedDate': '2022-02-02',
   'value': 49.59},
  {'fiscalDateEnding': '2020-12-31',
   'reportedDate': '2023-02-03',
   'value': 2.96},
  {'fiscalDateEnding': '2021-12-31',
   'reportedDate': '2023-02-03',
   'value': 5.69},
  {'fiscalDateEnding': '2022-12-31',
   'reportedDate': '2023-02-03',
   'value': 4.59}],
 'cik': '0001652044'}
There is a significant decrease in Basic EPS from 2019 ($49.56) to 2020 ($2.96). Additionally, have a look at GOOG’s raw Basic EPS:
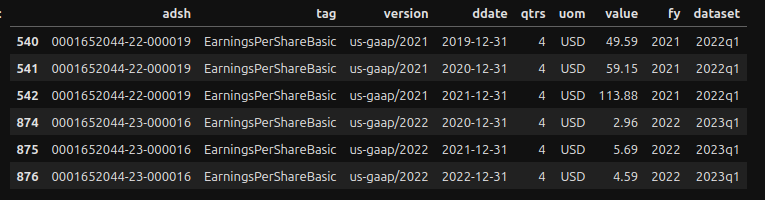
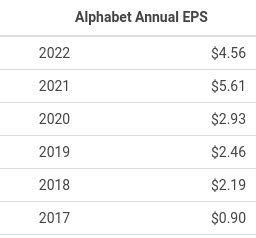
Similar high values can be found in rows 540, 541, and 542. In fact, for the years 2020 and 2021, the method get_tag_values returned $2.96 and $5.69, respectively, rather than $59.15 and $113.88. This is because, when the get_tag_values method finds two values for the same period, it returns the value of the most recent data set. In this example, if it finds two values for 2021 ($113.88 and $5.69), it will return $5.69 because it is part of the most recent data set; however, for the year 2019, it will return $49.59. This discrepancy can be explained by the 20-for-one stock split that occurred on July 5. In order to compare with current values, the years before 2019 (inclusive) need to be adjusted to reflect the stock split. This can be achieved by dividing the data by 20, which results in $2.48 for 2019 and $2.96 ($59.15/20) for 2020. The calculated score for 2020 ($59.15/20) matches row #874. These figures can be cross-checked with data from another source, such as Macrotrend:
Any adjustments related to a stock split will apply to tags related to Share, for example, ‘CommonStockSharesOutstanding’, CommonStockSharesAuthorized, etc. You can use the get_nums_for_tag method to find out tags with ‘PerShare’ in the name, as shown below:
get_nums_for_tag('GOOG', 'PerShare')Finally, I hope you found the information beneficial, and thank you for reading all the way through. I appreciate all your support.


