
A Technical Deep Dive into Chrome’s Web Vitals and Next.js reportWebVitals
Understanding the Web Vitals metrics, how and when the data is collected and subsequently cleaned up.

⚠️ Disclaimer
Please note that this is not just a standard explanation. It’s an in-depth exploration of the library that involves delving into the source code itself. By the end of this article, you will acquire an understanding of how the metrics are collected, the APIs employed and how the observers are cleared. Prepare for a deep dive that goes beyond the surface.
Learn how to use reportWebVitals with analytics tool here!
Introduction
In today’s fast-paced digital landscape, delivering a seamless and engaging user experience is paramount for the success of web applications. This journey towards optimization begins with a comprehensive understanding of the performance metrics and the tools that empower us to measure and enhance them. In this technical exploration, we delve into the realms of Chrome’s web-vitals library and its integration with Next.js through the reportWebVitals function. By deciphering the inner workings of these tools, we uncover invaluable insights that enable developers to elevate their applications’ performance, responsiveness, and overall user satisfaction.
Expected outcome
After reading this article, you will learn about:
- The brief definition of web-vitals and Next.js custom performance metrics using reportWebVitals
- Quick setup
- The underlying mechanism for collecting data by these metrics, including the employed API
- The point at which these metrics become ready for consumption
- Cleanup mechanism
Usage of web-vitals and reportWebVitals
- Measuring user-centric performance metrics for web applications
- Diagnosing real-user performance issues
- Sending the data to analysis tools such as Google Analytics, Vercel Analytics and Segment.
Chrome’s web-vitals library
The web-vitals library is a small library for measuring important website performance metrics as experienced by real users. It matches how they’re measured by Chrome and reported to other Google tools (e.g. Chrome User Experience Report, Page Speed Insights, Search Console’s Speed Report), which makes it super reliable and consistent.
The library supports not only the Core Web Vitals but also some other useful metrics:
Core Web Vitals
- Cumulative Layout Shift (CLS): The cumulative score of the layout shift that occurs during the entire lifespan of a page.
- First Input Delay (FID): The time between user’s first interaction with a page (tapping on a button, etc) and the browser is actually able to begin processing event handlers in response to that interaction.
- Largest Contentful Paint (LCP): The render time of the largest image or text block visible within the viewport, relative to when the page first started loading.
Other metrics
- First Contentful Paint (FCP): The time from when the page starts loading to when any part of the page’s content is rendered on the screen.
- Time to First Byte (TTFB): The time between the request for a resource and when the first byte of a response begins to arrive.
- Interaction to next Paint (INP): The time taken between an user interaction (tapping on a button, etc) and your content which is the next paint visually updating in response.
⚠️ Interaction to Next Paint (INP) is a pending Core Web Vital metric that will replace First Input Delay (FID) in March 2024.
The library can seamlessly integrate into any web application written in JavaScript, regardless of your web development framework.
import {onCLS, onFID, onLCP} from 'web-vitals';

onCLS(console.log);
onFID(console.log);
onLCP(console.log);
Next.js extends the library with its own reportWebVitals function to provide additional metrics to measure the hydration on the app, due to Next.js’s wide-ranging rendering methods such as server-side rendering (SSR) and static-site generation (SSG). We can get access to these web vitals through reportWebVitals function in Next.js, without installing the web-vitals library separately.
Next.js reportWebVitals function
According to the Next 9.4 release blog, Next.js reportWebVitals is leveraging Google Chrome’s web-vitals library and extending it with additional custom metrics for Next.js. In addition to the core metrics listed above, the followings are the additional metrics that help measure the time it takes for the page to hydrate and render:
Next.js-hydration: Length of time it takes for the page to start and finish hydrating (in ms)Next.js-route-change-to-render: Length of time it takes for a page to start rendering after a route change (in ms)Next.js-render: Length of time it takes for a page to finish render after a route change (in ms)
This reportWebVitals function is triggered when the final values for any of the metrics have finished calculating on the page. It provides basic data such as the name and value (in milliseconds) for each web vital.
It can be implemented by defining a reportWebVitals function at the very top level of your Next.js app which is _app.ts file.
export function reportWebVitals(metric: NextWebVitalsMetric): void {
  console.log(metric);
}

function MyApp({ Component, pageProps }) {
  return <Component {...pageProps} />;
}

export default MyApp;
or ultilize the hook useReportWebVitals hook in the component.
import { useReportWebVitals } from 'next/web-vitals'

export function WebVitals() {
  useReportWebVitals((metric: NextWebVitalsMetric) => {
    console.log(metric)
  })
}
Additional data to pinpoint the source of the problem
In certain scenarios, it may be necessary to pinpoint the source of the problem for debugging purposes. For instance, when dealing with Cumulative Layout Shift (CLS), it can be helpful to determine the first element that shifted during the largest layout shift. Similarly, with Largest Contentful Paint (LCP), it may be valuable to pinpoint the specific element corresponding to the LCP on the page. If the LCP element happens to be an image, having the URL of the image resource can aid in locating the asset that needs optimization.
Attribution, which involves pinpointing the primary contributor to the Web Vitals score, provides more comprehensive information such as entries for PerformanceEventTiming, PerformanceNavigationTiming and PerformanceResourceTiming. To enable this, we need to configure the next.config.js:
experimental: {
  webVitalsAttribution: ['CLS', 'LCP', 'FID'];
}
How the web-vitals and reportWebVitals collect the data
Web vitals
The reporting functions namely onFCP, onTTFB, onLCP, onFID, and onCLS which are imported from the web-vitals module, serve as event listeners and utilise the Performance Observer API from Performance API internally. They allow us to observe performance measurement events and be notified whenever new performance entries are recorded in the browser's performance timeline.
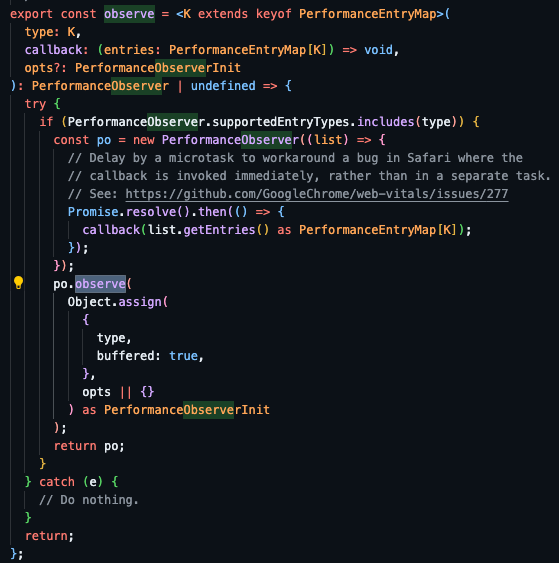
The observation process is initiated by calling PerformanceObserver.observe() and passing in the relevant options to specify which performance entries to observe. Once the performance entries are recorded, the callback function associated with the observer is invoked, allowing us to handle and report the collected metrics.
Below is the source code of the observe util function in web-vitals, the highlighted code po.observe() is the PerformanceObserver.observe().
Next.js custom metrics
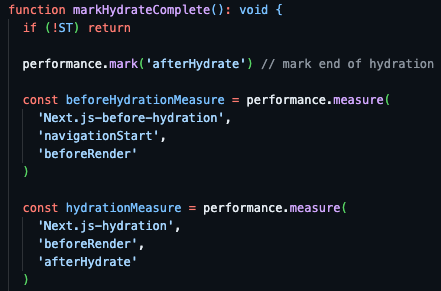
On the other hand, Next.js custom metrics are recorded using the PerformanceMark and PerformanceMeasure interfaces which are from Performance API as well. It calls performance.mark() to create an PerformanceEntry object to put a timestamp marker in the browser’s performance timeline, and calls performance.measure() to measure the time between two marks.
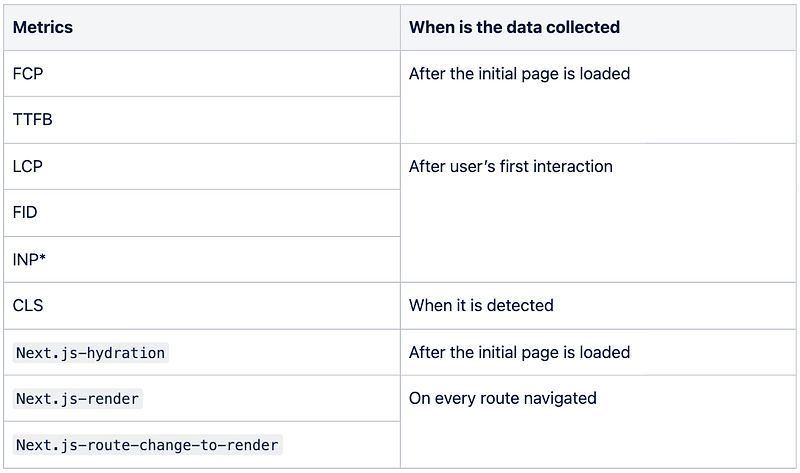
Since all the metrics are listening to different events, the data will be collected and ready to be consumed at different timestamps.
They are like event listeners — so when are they stopped or cleaned up?
Since they work like event listeners, to ensure proper memory management and prevent performance issues, it is essential to handle the performance observers appropriately. The following actions are taken to stop or clean up the observers under specific conditions:
- For metrics like Largest Contentful Paint (LCP) and First Input Delay (FID), the observer is stopped when the user performs
keydownorclickactions. This means that once the user interacts with the page, the observer is disconnected using thePerformanceObserver.disconnect()method. This prevents the observer from receiving any further performance entries related to LCP and FID. - In the case of Cumulative Layout Shift (CLS), the observer remains active throughout the entire lifespan of the page. It continues to monitor for layout shifts, even when the user hides or backgrounds the page as it is listening to the page’s visibility state. However, it is important to note that the CLS observer starts listening only after the FCP has been reported.
By disconnecting the observers when they are no longer needed, we avoid unnecessary resource consumption and potential memory leaks. This approach helps maintain optimal performance while still collecting the required metrics for analysis.
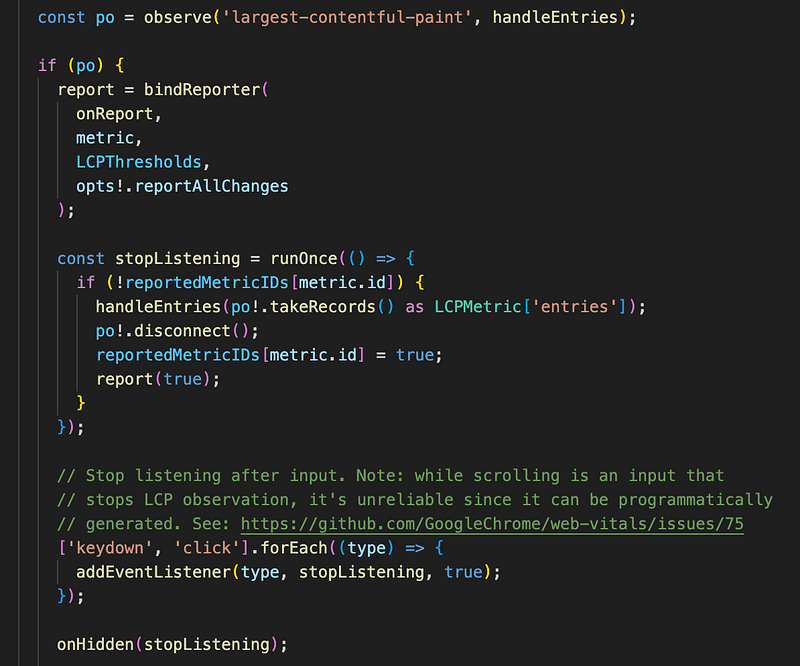
Example: onLCP
where po is the performance observer registered, and stopListening is the function to stop the observer and trigger the metric reporting. It will be executed once keydown and click actions are performed.
In Next.js, the performance measurement is extended with additional custom metrics such as Next.js-hydration, Next.js-render and Next.js-route-change-to-render. Since they are recorded using the PerformanceMark and PerformanceMeasure interfaces, the clean up mechanism is different from Performance Observers in web vitals. After the marking and measurement, it calls performance.clearMarks() to remove the marks and performance.clearMeasures() to clear the measurements. The measurement on the value of Next.js-hydration will not be clear and will stay throughout the entire lifespan of the Next app while Next.js-render and Next.js-route-change-to-render will be clear and recorded again whenever route navigation is performed.
Example: Next.js-hydration
where it calls clearMarks() but not clearMeasures() after measurement.
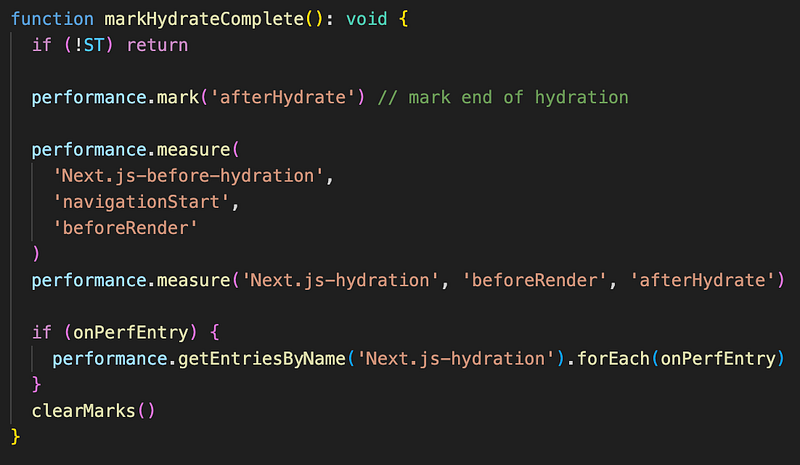
Next.js-hydration (https://github.com/vercel/next.js/blob/canary/packages/next/src/client/index.tsx)Example: Next.js-render and Next.js-route-change-to-render
where it calls both clearMarks() and clearMeasures() after measurement.
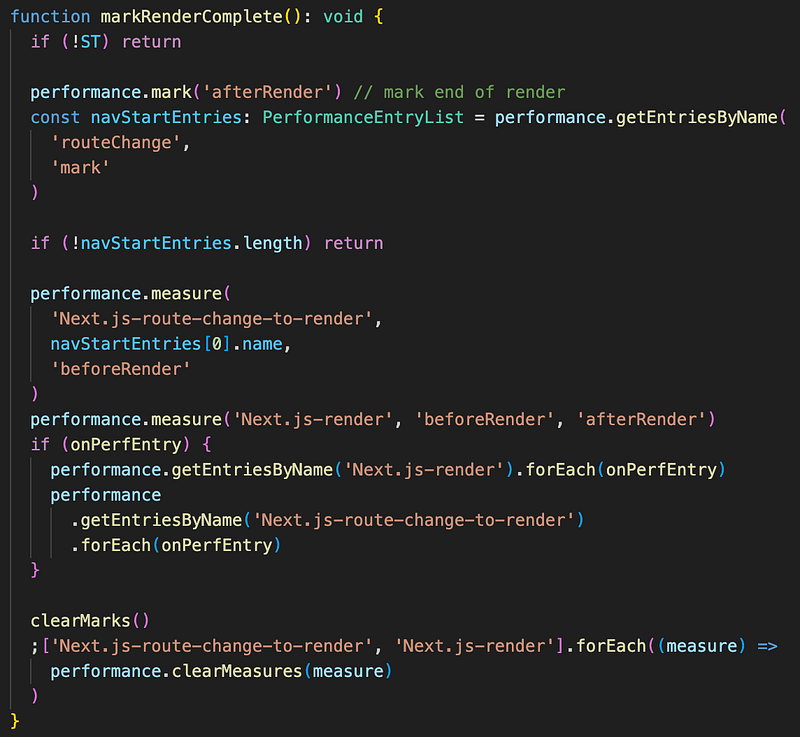
Next.js-render and Next.js-route-change-to-render (https://github.com/vercel/next.js/blob/canary/packages/next/src/client/index.tsx)Summary
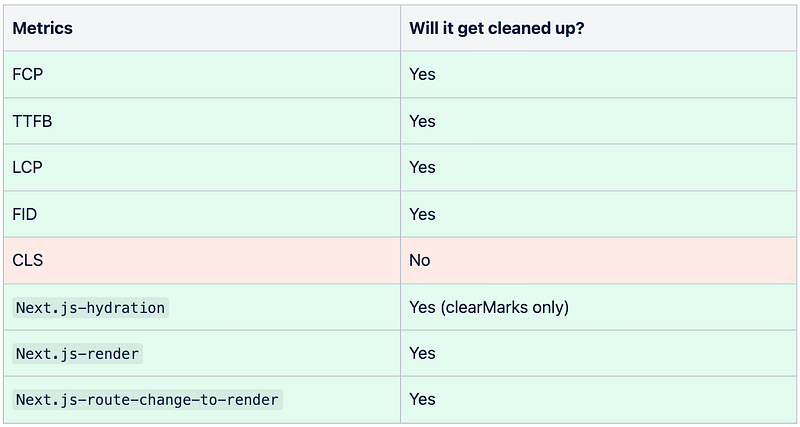
Last but not least
Now, with a solid understanding of their functionality and data collection process, the next question arises: how do we transmit this data to our analysis tools? Currently, comprehensive guides only exist for integration with Google Analytics, Google Tag Manager, and Vercel — logical, given their tool ownership.
In Part 2, we will delve into the integration with Segment — a gateway that extends to numerous third-party analysis tools. Coupled with feature flagging, it enhances observability across diverse user journeys and brings your product analysis closer to the users. Read the article here!
Resources
GoogleChrome/web-vitals: https://github.com/GoogleChrome/web-vitalsvercel/next.js: https://github.com/vercel/next.js/tree/canaryobserveutil function in web-vitals: https://github.com/GoogleChrome/web-vitals/blob/main/src/lib/observe.tsonLCP: https://github.com/GoogleChrome/web-vitals/blob/main/src/onLCP.tsNext.js-hydration: https://github.com/vercel/next.js/blob/canary/packages/next/src/client/index.tsxNext.js-renderandNext.js-route-change-to-render: https://github.com/vercel/next.js/blob/canary/packages/next/src/client/index.tsx
Thank you for reading until the end. Please consider following the writer and this publication. Visit Stackademic to find out more about how we are democratizing free programming education around the world.


