
A Simple Technical Indicator to Find Stocks Outperforming the Market
And how I use it for momentum trading

It’s no surprise that the overall market sentiment is important if you’re a trader/investor, and during 2022, the conditions have been particularly tricky to extract profits from. However, this has indeed been an excellent year to sharpen a trading edge.
One way I have been refining my edge is to evaluate how is a stock performing compared to the overall market. In other words, if a trade is setting up, can we understand if the stock is stronger than the overall market and therefore likely to make good gains when the selling pressure eases.
Take STNG for example, there may have only been a “momentum pause” in the stock when the market was going straight down (measuring against the Nasdaq-100 index ETF, QQQ). Clearly the stock showed that the market could not bring it down.
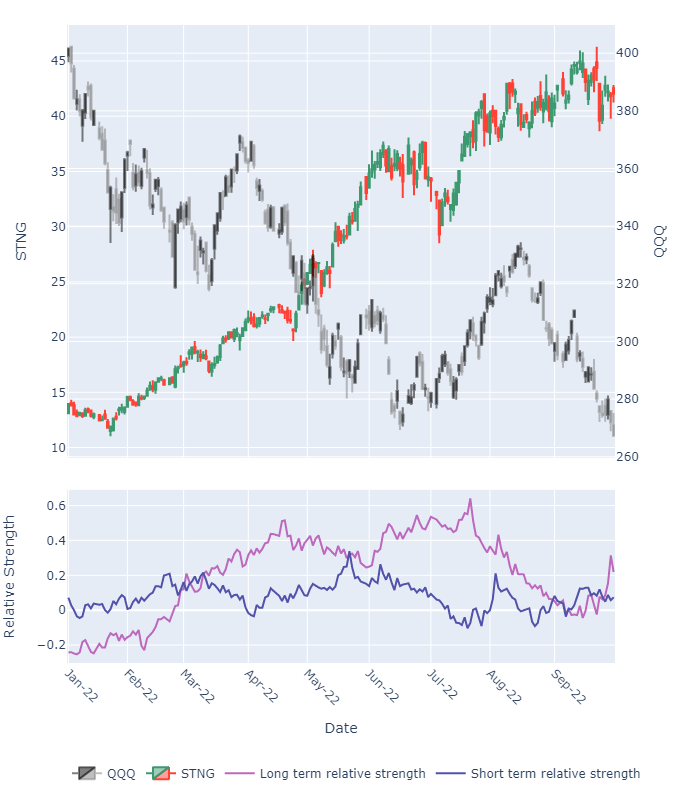
The bottom plot shows the result from a simple calculation I perform to measure relative strength, i.e. how this stock is performing compared to the market. I like to think of this showing investor interest in a stock compared to the overall market sentiment.
In this article I will describe:
- How to calculate the simple relative strength indicator.
- How this indicator performs as a trading strategy.
- How you could benefit from the use of the indicator.
There is also some Python code which you can steal at the end 🙂
How to Calculate the Relative Strength Indicator
Before proceeding, I want to make it super clear that this indicator is not the well known RSI (Relative Strength Index) which is derived from a single instrument, this indicator compares two different instruments.
The calculation is actually really simple and can be applied on any timeframe (although I use the daily timeframe). It is achieved in this 3 step process:
- Take the last n measurements of the stock and comparison stock price. I use the closing prices.
- Scale both time-series by the value of that instrument on the point furthest back in time (so both time-series starts with the value = 1).
- Perform
numpy.mean(stock_scaled-index_scaled)to get the relative strength for that trading session.
And that’s it! Here is a GIF showing this in action for the example given above:
Wait, why do you scale by the day furthest back in time?
We need to scale because the instruments are massively different in price, and therefore tough to compare without. Scaling using this approach allows you to see the performance of the instruments from that point.
For example, if the stock has been going up since n days ago, and the market is going down, it’s very clear to see a divergence in both time-series.
You can of course experiment with other scaling methods, perhaps another works better, if so, do share in the comments!
Why did you not use something like an Euclidean distance?
The Euclidean distance will give a positive number. What I’m interested in is how good/bad a stock is compared to the overall market sentiment. This method allows for negative numbers which says that the market is showing more strength than the stock (which could be a potential sign of weakness).
This is a lagged indicator right?
Yup, anything derived from price action will be!
So… what lookback period should I use?
Honestly this requires some experimentation and you have to find what suits you. However, I like to use two relative strength calculations over the following lookback periods:
- Short term behaviour = the last 20 days (~ 1 month of trading activity)
- Long term behaviour = the last 60 days (~ 3 months of trading activity)
I feel this gives a better overall picture than just using a single lookback period.
Are there other time-series comparison methods we can use?
I have considered using dynamic time warping to give a distance measure, however, this will give a positive number like the Euclidean distance.
That algorithm works better as a scanner, which I have explained here:
A Backtest Using This Indicator
Before talking about the backtest, let me reiterate that this is a lagged indicator and is likely to produce false/late signals. However, I was still curious if this indicator would perform when crafted into a trading strategy 🙂
The strategy is based on the following rules:
- If the short and long term relative strength indicators are above zero, then buy the instrument on the next open.
- If the short term relative strength crosses below zero, then sell on the next open.
The basic principle is that the long term trend shows a strong investor confidence, and the spike in the short term trend shows that it may have good temporary money flow we can jump on; i.e. buy high, sell higher.
I ran this backtest over all small, medium and large cap stocks in the nasdaq stock screener from January 2022-October 2022, each time collecting the three following statistics:
- The mean percentage gain/loss per trade.
- The mean holding time (in days).
- The multiples of your initial investment, if you applied the strategy to only that stock.
The histograms below show the results from every backtest:
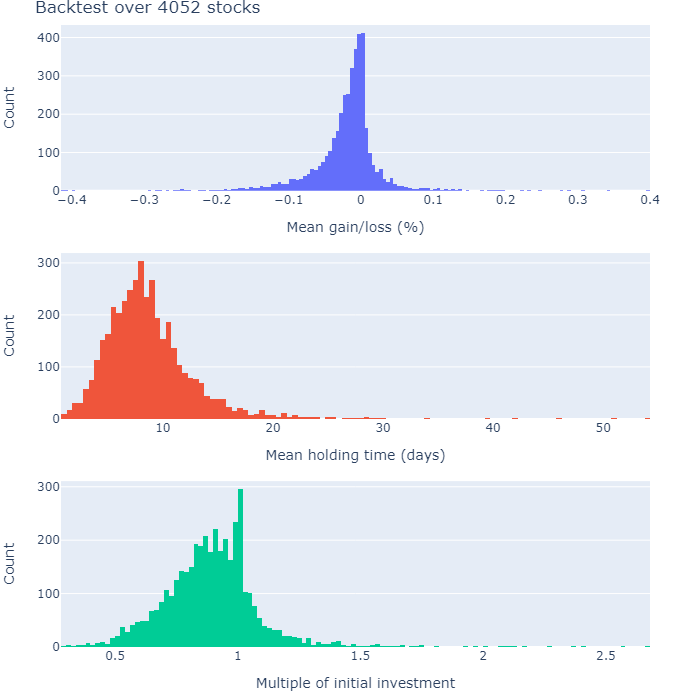
Clearly, this strategy is rubbish. Perhaps it can be improved with hyperparameter optimisation, similar to what I did using genetic algorithms:
However, I imagine that even after optimising it will be a sub-par strategy. I think this indicator is best used to gather a sense of the bigger picture, and used in combination with another indicator and/or trading concept (see the next section!).
How This Indicator Can Help
Personally, I think this technical indicator is best used to give conviction in a technical pattern. As a concrete example, when I am looking for a flag-breakout pattern, the relative strength allows me to evaluate whether this particular stock is stronger than the overall market conditions.
Here are two examples of powerful flag-pattern breakouts that have occurred this year, both which have shown relative strength against the market:
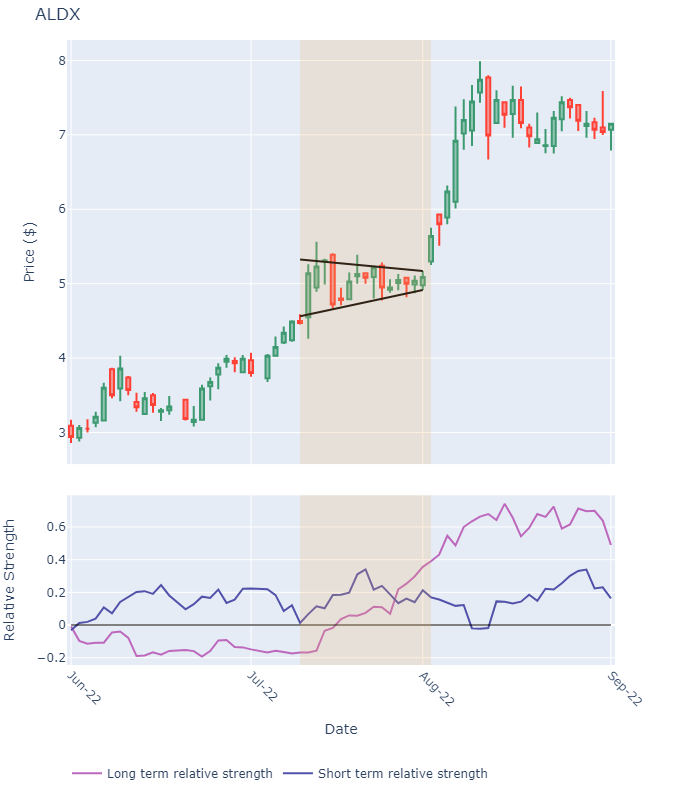
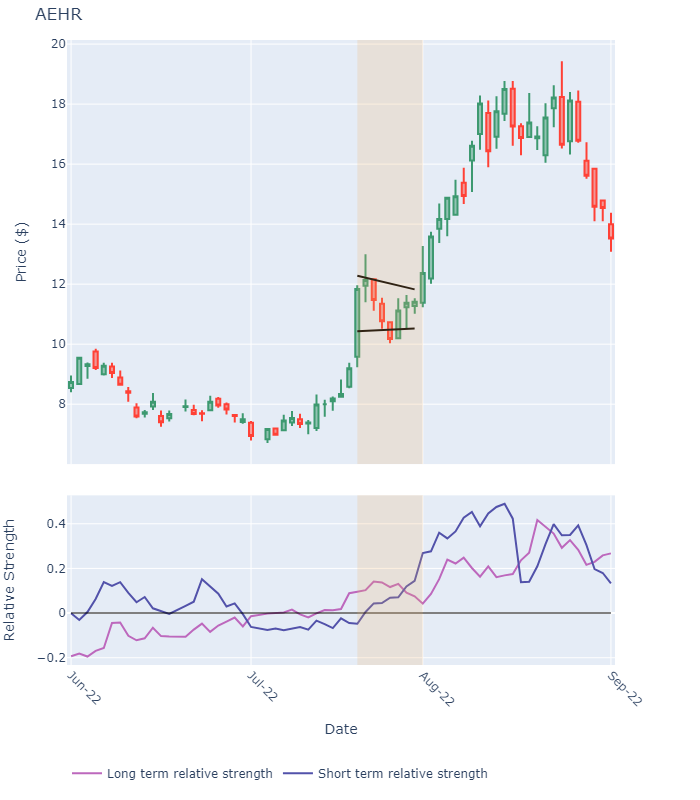
Both the shorter/longer term relative strength indicate that the stock is performing well in comparison to the overall market, and hence, a decent candidate to consider.
There are only two examples, hardly a good sample size!
Don’t worry, I know! This is all just for illustration 🙂
As previously said, I use it as a measure of conviction, not precision. I see a technical pattern I like, check the relative strength, and then consider one or two other factors before buying (all part of my trading flow).
No indicator/method is perfect and you should never 100% believe anything on the internet without testing it yourself.
Wow, those trend lines are great, how did you draw them?
Ah, thanks for noticing! You can read all about that in this article I wrote:
Wrapping Up
In this short article I have shown how I use super basic calculation to measure a stock’s performance against the overall market sentiment. I think this indicator is best used in conjunction with other trading concepts, and helps illuminate the bigger picture.
There is a lot of scope for improvement of course, perhaps the lookback periods are not optimal, or perhaps there is a better scaling/evaluation approach. It would be great to hear if anyone extends on my work!
Thank you for reading, I hope you enjoyed the article! Please feel free to connect with me on LinkedIn — I’d love to hear from you! Also feel free to follow/DM me on twitter.
If you are thinking getting a medium account, then please consider supporting me and thousands of other writers by signing up for a membership. For full disclosure, signing up through this link grants me a portion of your membership fee, at no additional cost to you (a win-win for sure!).
Or if you’d like another way to support my content creation, then you could

Because I work a full-time job, go to the gym, trade, and write on Medium, I use a lot of coffee!
The Full Code
When run, this code will calculate the relative strength and make the figure presented in the introduction:
Subscribe to DDIntel Here.
Visit our website here: https://www.datadriveninvestor.com
Join our network here: https://datadriveninvestor.com/collaborate


