
A Simple Stock Picking Strategy with 6 Key Financial Metrics — Part 2
This is part 2 of the article A Simple Stock Picking Strategy with 6 key Financial Metrics — Part 1.
Disclaimer: The information provided here is for informational purposes only and is not intended to be personal financial, investment, or other advice.
Part 1 focuses on a particular stock in comparison to a group of equities that are similar to it. The ranking within the chosen group of stocks is the main topic of Part 2.
Part 1’s prerequisite #1 (stock on focus) is no longer necessary. Part 2 still requires prerequisites #2 and #3, though.
No changes to the Python libraries chosen for Part 1.
Code is available as a Jupyter notebook on GitHub.
Load Properties
configs = Properties()

with open('config/yf_stock_picker_p2.properties', 'rb') as config_file:
     configs.load(config_file)

SYMBOLS = configs.get('SYMBOLS').data.split(',')
METRICS = configs.get('METRICS').data.split(',')
WEIGHTS = configs.get('WEIGHTS').data.split(',')

# Convert weights to integers
WEIGHTS = [int(i) for i in WEIGHTS]
With the exception of the TICKER property, which is not needed, other properties remain unaltered.
- SYMBOLS — list of symbols from the Stock Screener (step 3 of Prerequisite — Part 1)
- METRICS — six key Metrics (unchanged)
- WEIGHTS — weights assigned to each metric (unchanged)
A sample property file:
# Related ticker symbols
SYMBOLS = INTU,CDNS,WDAY,ROP,TEAM,ADSK,DDOG,ANSS,ZM,PTC,\
           BSY,GRAB,SSNC,APP,AZPN,MANH,ZI,NICE

# Metric names
METRICS = Operating Margin,Dividend Yield,Dividend Cover,Debt/EBITDA,P/E ratio,PEG ratio

# Equals weight of 1 for each metric
WEIGHTS = 1,1,1,1,1,1
Note: ‘Collecting Key Metrics’ section is omitted as there is no modification to this logic in part 2.
Populate Key Metrics
To fill in the Key Metrics values for the Stocks listed in the “SYMBOLS” parameter, we’ll reuse the data that was collected in the “Collecting Important Metrics” step.
# DF to collect value key metrics for all the tickers
key_metrics_value_df = pd.DataFrame()

for idx in range(len(METRICS)):
    key_metrics_value_df[METRICS[idx]] = raw_metrics[idx]
key_metrics_value_df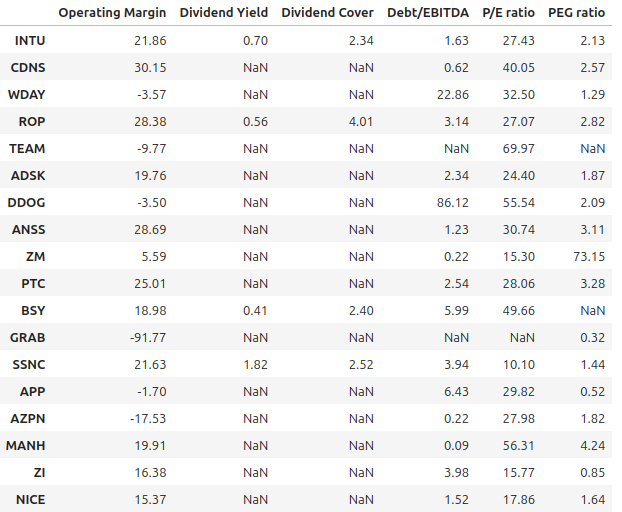
To lessen the influence on ranking, missing dividends and negative ratios for ‘Forward PE’ or PEG are marked as ‘NaN’.
Calculate Scores for each Metric
To determine scores for each stock, we will use previously calculated Key Metrics data.
Note: section ‘Score for each Metric’ in Part 1 provides more information on how scores are determined.
# DF to hold key metrics scores
key_metrics_score_df = pd.DataFrame()

# Set the index to SYMBOLS
key_metrics_score_df.index = SYMBOLS

# Loop through raw data we collected under Collect Key Metrics section
for idx in range(len(raw_metrics)):
    if (idx >= 3):
        # Ranking is on ascending order (lower the better)
        ranking_list = get_ranking_list(raw_metrics[idx], False)
    else:
        # Ranking is on descending order (higher the better)
        ranking_list = get_ranking_list(raw_metrics[idx], True)

    # List of scores for a metric
    score = []
    # Loop through the ranking list to calculate the score
    for ranking in ranking_list:
        if ranking == 'NA':
            score.append(0.0)
            continue
        rank, total = tuple(map(int, ranking.split('/')))
        score.append(round(((total - rank) + 1)/total,2))

    # Append the Score to the metric name
    col_name = f'{METRICS[idx]} Score'
    key_metrics_score_df[col_name] = score
key_metrics_score_df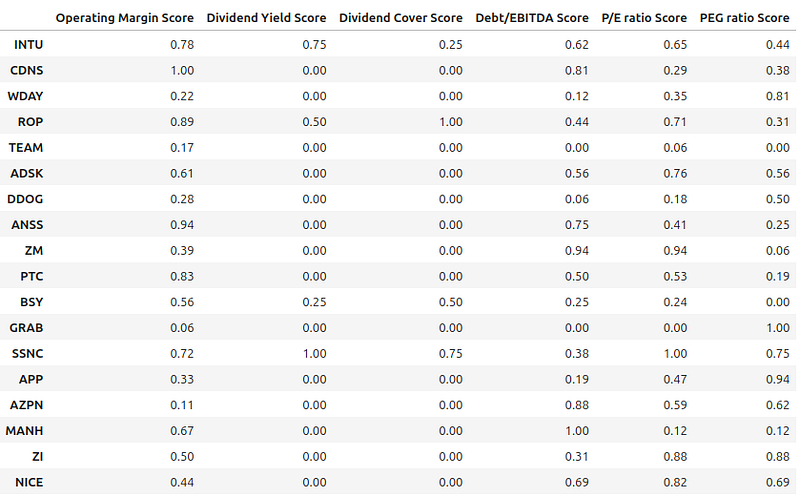
Calculate Total Score
The next step is to add up the metric scores to get the overall score.
# List of total scores for each stock
total_score = []
for symbol in SYMBOLS:
    # Sum all scores across key metrics * weights and normalize the score out of 10
    total_score.append(round(((((key_metrics_score_df.loc[symbol] * WEIGHTS).sum())/sum(WEIGHTS)) * 10), 2))
key_metrics_score_df['Total Score'] = total_score
key_metrics_score_df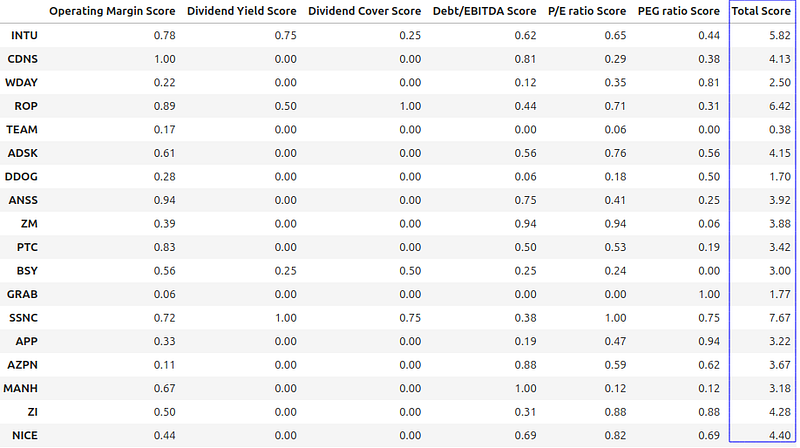
Ranking using Total Score
We should be able to rank based on the score since we know the total scores for each stock.
# Each score in this list has the format: score/total, e.g. 4/17
tot_score_ranking = get_ranking_list(key_metrics_score_df['Total Score'], True)
# Only interested in the score part
ranking = [x.split('/')[0] for x in tot_score_ranking]
key_metrics_score_df['Ranking'] = ranking
key_metrics_score_df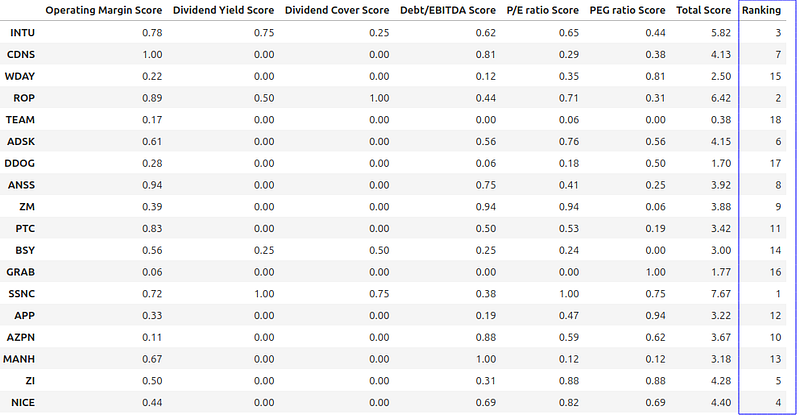
Conclusion
As the article’s title suggests, a simple stock picking approach using six crucial metrics is provided. This strategy is detrimental to companies with no dividends or negative earnings. Yet, it is important to keep in mind that both a new and an established company may go through this and endure brief negative earnings.
The ranking’s absolute character, which disregards the size of differences between two stocks, is another consideration. For example, even if two stocks had extremely low P/E ratios, one will still be ranked higher than the other.
I hope you found the information interesting and value your feedback.
In Plain English
Thank you for being a part of our community! Before you go:
- Be sure to clap and follow the writer! 👏
- You can find even more content at PlainEnglish.io 🚀
- Sign up for our free weekly newsletter. 🗞️
- Follow us on Twitter(X), LinkedIn, YouTube, and Discord.


