
A simple Guide to trading with the Ichimoku Kinko Hyo Indicator (Python Tutorial)
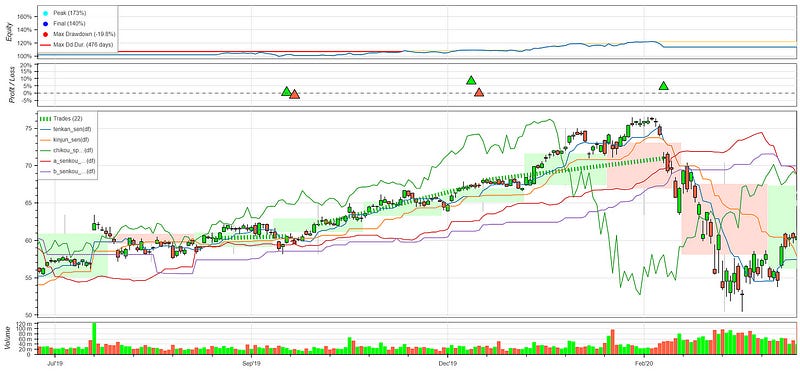
Chart generated with data from Tiingo API and backtesting.py
The Ichimoku Kinko Hyo is one of the more complex technical indicator systems since it consists of multiple components and the implementation can be intimidating.
In this post we are going to review the elements of the Ichimoku Kinko Hyo, discuss the different components and their purpose, go over the implementation steps in Python and create a sample trading strategy for this indicator.
If you always wanted to learn how to trade with the Ichimoku Kinko Hyo trade system but found it too technically challenging, this guides for you.
This story is solely for general information purposes, and should not be relied upon for trading recommendations or financial advice. Source code and information is provided for educational purposes only, and should not be relied upon to make an investment decision. Please review my full cautionary guidance before continuing.
What is Ichimoku Kinko Hyo?
According to Wikipedia, Ichimoku Kinko Hyo is a technical indicator system by Goichi Hosoda, a Japanese journalist in the 1930’s. The system is made up of five lines and is used to indicate trend direction, support and resistance levels, and potential reversal points.
Here are the five components of this system:
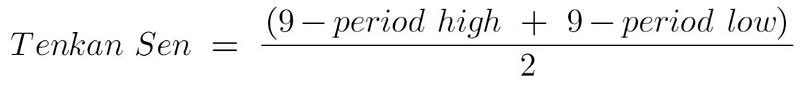
Tenkan Sen
The ‘Tenkan Sen’ line, also called ‘Conversion Line’, is a signal line. The default uses a 9-period parameter, which means it is the fastest indicator in the system and follows the price the closest.
A bullish signal is triggered when the Tenkan Sen crosses the Kijun Sen from below.
The Tenkan Sen is created by averaging the high and low of the past nine periods.
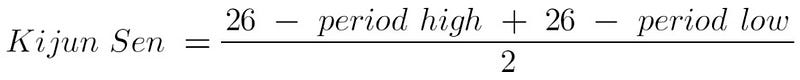
Kijun Sen
The ‘Kijun Sen’ line, also called the ‘Base line’, can be used as a confirmation and can also act as a trailing stop.
A bullish signal is triggered when the Tenkan Sen crosses the Kijun Sen from below.
The Kijun Sen is created by averaging the high and low of the past 26 periods.
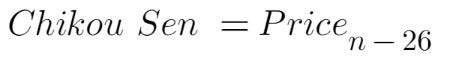
Chikou Span
The Chikou Span, also called ‘Lagging Line’, can be used as a confirmation.
A bullish signal is triggered when the price crosses the Chikou Span from below.
The line is calculated by simply shifting the price 26 periods to the past.
Senkou Span A
The Senkou Span A, also called the ‘Leading Cloud’ line, is used to evaluate trend and future support/resistance. The cloud is formed by combining the Senkou Span A and the Senkou Span B.
The cloud can be used to evaluate the overall trend. A bullish trend is present when the price is above the cloud or when the Senkou Span A is above the Senkou Span B.
Often, the area between the Senkou Span A and B lines will be shaded green when the A line is above the B line and red when the B line is above the A line. The shading gives the indicator the appearance of a cloud.
Senkou Span B
The Senkou Span B, also called the ‘Trailing Cloud’ line, is the second part of the cloud component.
A bullish trend is present when the price is above the cloud or when the Senkou Span A is above the Senkou Span B.

For a more detailed explanation on how to calculate the different indicators, check out the description on the Investopedia.com page or the Stockcharts.com page.
Using Pandas_TA to calculate the Ichimoku Kinko Hyo
Pandas Technical Analysis (Pandas TA) is Python library implements over 130 technical indicators and more than 60 candlestick patterns.
Among the implementations of tech indicators is also the Ichimoku system, which provides us with an easy way to calculate the Ichimoku indicators and clouds.
Although can specify the input parameters for the Ichimoku system in Pandas_TA, for simplicity I suggest to start using it with the default parameters.
The Pandas_TA implementation for Ichimoku returns two data frames. One returns the high and low indicators, and the other returns the look-ahead indicator. We will be combining the two so that they are easily accessible in one dataframe:
ichimoku = ta.ichimoku(df['High'], df['Low'], df['Close'])
combined_df = pd.concat([df, ichimoku[0], ichimoku[1]], axis=1)
Once calculated, the component indicators can be accessed as columns in the dataframe as follows:
- Tenkan Sen: ITS_9
- Kijun Sen: IKS_26
- Chikou Span : ICS_26
- Senkou Span A (Leading Cloud): ISA_9
- Senkou Span B (Leading Cloud): ISB_9
The pandas_ta library makes it easy to calculate the Ichimoku components.
In this tutorial we will calculate the Ichimoku components manually.
A sample Strategy
The Ichimoku framework can be used in many ways. In this post we are going to use a sample strategy based on a simple set of trading rules:
Long
- Tenkan Sen crosses Kijun Sen from below (signal)
- Price is above Senkou Span A and B cloud (trade filter)
Short
- Tenkan Sen crosses Kijun Sen from above. (signal)
StockDads.com is a thriving trading community with AI trading stock/crypto alerts, expert advice and a ton of educational materials. Get a 30% forever discount with code ‘BOTRADING’.
Implementation
This post only contains the most important functions. You can download the complete Python script from my ‘B/O Trading Blog’ on Substack.
Below the calculation of the five Ichimoku indicators. One big thing to note here that the Ichimoku indicator combines both forward and backward looking indicators. It is very important to be aware of the current place in time when calculating the indicator.
In the approach below in order to calculate the forward looking cloud we are using data from the present. The Chikou Span is calculated by shifting 26 periods backwards. This also means when evaluating the strategy, there won’t be any Chikou Span values available for the last 26 periods and you will have to take a backward looking approach to incorporate the Chikou Span signals into your strategy.
def tenkan_sen(price_df):
    # (9-period high + 9-period low)/2))
    df = price_df.copy()
    df['tenkan_high'] = df['High'].rolling(window=9).max()
    df['tenkan_low'] = df['Low'].rolling(window=9).min()
    df['tenkan_sen'] = (df['tenkan_high'] + df['tenkan_low']) / 2

return df['tenkan_sen']

def kijun_sen(price_df):
    # (26-period high + 26-period low)/2))
    df = price_df.copy()
    df['kijun_high'] = df['High'].rolling(window=26).max()
    df['kijun_low'] = df['Low'].rolling(window=26).min()
    df['kijun_sen'] = (df['kijun_high'] + df['kijun_low']) / 2
    return df['kijun_sen']

def chikou_span(price_df):
    # Close shifted 26 days to the past
    df = price_df.copy()
    df['chikou_span'] = df['Close'].shift(-26)
    return df['chikou_span']

def a_senkou_span(price_df):
    #  (Tenkan Line + Kijun Line)/2))
    df = price_df.copy()
    df['tenkan_sen'] = tenkan_sen(df)
    df['kijun_sen'] = kijun_sen(df)
    df['senkou_span_a'] = ((df['tenkan_sen'] + df['kijun_sen']) / 2).shift(26)
    return df['senkou_span_a']

def b_senkou_span(price_df):
    #  (52-period high + 52-period low)/2))
    df = price_df.copy()
    df['span_b_high'] = df['High'].rolling(window=52).max()
    df['span_b_low'] = df['Low'].rolling(window=52).min()
    df['senkou_span_b'] = ((df['span_b_high'] + df['span_b_low']) / 2).shift(26)
    return df['senkou_span_b']
This is the backtesting.py strategy implementation. In the init() function we calculate the indicators. In the next() function we implemented the strategy rules and execute the buy() and sell() actions.
class IchimokuStrategy(Strategy):
    def init(self):
        super().init()

        # Add indicators
        self.tenkan_sen = self.I(tenkan_sen, self.data.df, plot=True)
        self.kijun_sen = self.I(kijun_sen, self.data.df, plot=True)
        self.chikou_span = self.I(chikou_span, self.data.df, plot=True)
        self.a_senkou_span = self.I(a_senkou_span, self.data.df, plot=True)
        self.b_senkou_span = self.I(b_senkou_span, self.data.df, plot=True)
    def next(self):
        super().init()
        long_ind = 0
        short_ind = 0
        #  Long: Tenkan Sen crosses Kijun Sen from below
        if self.tenkan_sen[-1] >= self.kijun_sen[-1] and self.tenkan_sen[-2] <= self.kijun_sen[-2]:
            long_ind += 1
        #  Price is above the cloud
        if self.data.Close[-1] > self.a_senkou_span[-1] and self.data.Close[-1] > self.b_senkou_span[-1]:
            long_ind += 1
        #  Short: Tenkan Sen crosses Kijun Sen from above
        if self.tenkan_sen[-1] <= self.kijun_sen[-1] and self.tenkan_sen[-2] >= self.kijun_sen[-2]:
            short_ind += 1
        if self.position.size == 0 and long_ind >= 2:
            self.buy()
        if self.position.size > 0 and short_ind >= 1:
            self.position.close()
This function instantiate the backtesting.py strategy and sets the starting capital and commission.
def run_backtest(df):
    df = df.set_index('Date')
    bt = Backtest(df, IchimokuStrategy, cash=10000, commission=0.000, trade_on_close=True, exclusive_orders=True,
                  hedging=False)
    stats = bt.run()
bt.plot()
    return stats
Let’s take a look at some of the results.
Results
In the chart below you can see the last 5 years of 1-day period data from Google (GOOGL). As you can see we have a couple of profitable trades. So great!
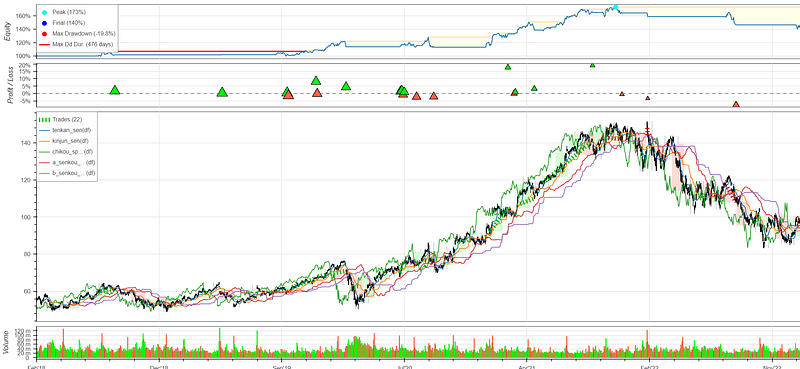
Chart created with data from Tiingo API
Let’s take a look at the strategy in detail:
- At this point you see the Senkou Span A moving above the Senjou Span B, which indicates a bullish trend. Another bullish indicator is that the price is above the cloud.
- The Tenkan Sen crosses the Kijun Sen indicator from below, which triggers the long entry.
- We exit the position when the Tenkan Sen crosses the Kijun Sen indicator from above. A variation of this rule would be to not exit the trade while the price is above the cloud so a positive trend continues in order to ride the trend until it reverses.
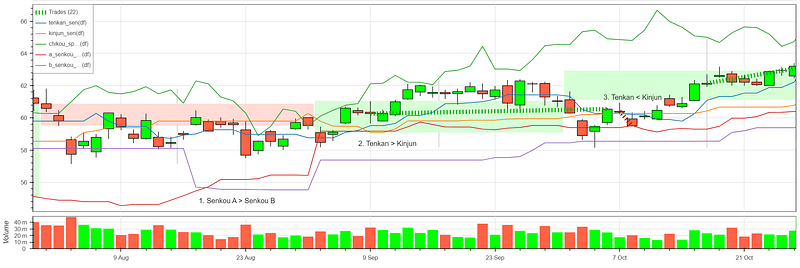
Chart created with data from Tiingo API
Summary
In this post we discussed what the Ichimoku Kinko Hyo system and it’s components, how to calculate the individual indicators and then implemented a simple strategy based on this indicator in Python. We finished up by reviewing some of the results of this strategy.
I hope you found this article helpful and informative. Happy trading!
If you enjoyed this post please ‘like’ it.
Data provided by Tiingo API
This post contains affiliate marketing links.


