
A Powerful and Practical Way to Load Test APIs
With Apache JMeter, Taurus, and your favorite DevOps platform

As per Wikipedia,
“Continuous testing is the process of executing automated tests as part of the software delivery pipeline to obtain immediate feedback on the business risks associated with a software release candidate.”
In my previous article, I wrote about how to perform functional testing of your APIs using Postman/Newman and integrate it into a DevOps platform. Another important aspect of automated testing is load testing, which helps us analyze the application behavior under stress.
There are various tools available in the market which can help us perform load tests. Apache JMeter is one of the most widely used open-source tools in this field.
This article expects you to have a basic understanding of REST APIs, Apache JMeter, and continuous testing.
Apache JMeter
Apache JMeter helps us perform load tests on various applications like:
- SOAP/ REST APIs
- FTP
- Database via JDBC
- LDAP
- Message-oriented middleware (MOM) via JMS
- Mail — SMTP(S), POP3(S) and IMAP(S)
- Native commands or shell scripts
- TCP
- Java Objects
It provides us with a nice GUI that can be used to create the test plan. It also provides us a command-line utility that helps us run the load test as a headless process. This feature helps us to integrate JMeter into various automation tools.
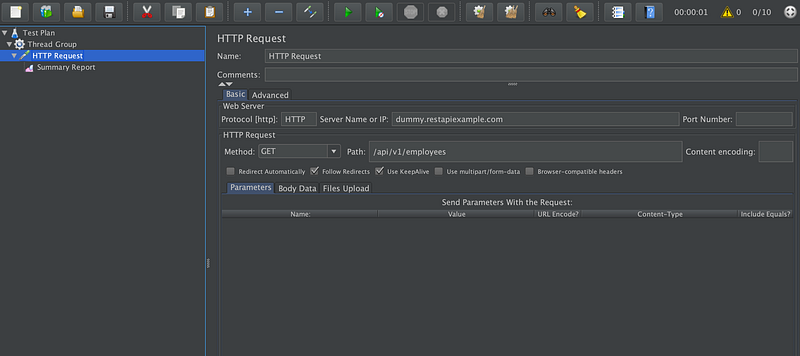
In this tutorial, I am using a very simple REST API from dummy.restapiexample.com.
Using JMeter, I am going to run the load test on the Get All Employees API.
Prepare and Execute the Test Plan
Using JMeter GUI, you can easily create a test plan that calls the APIs and prepares a summary report, as shown in the screenshot below.
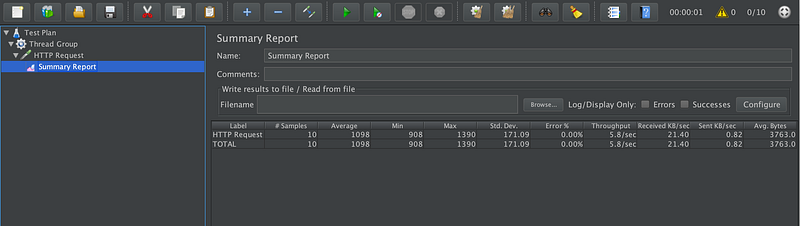
After execution, you can check out the result in the Summary Report section, as shown below.
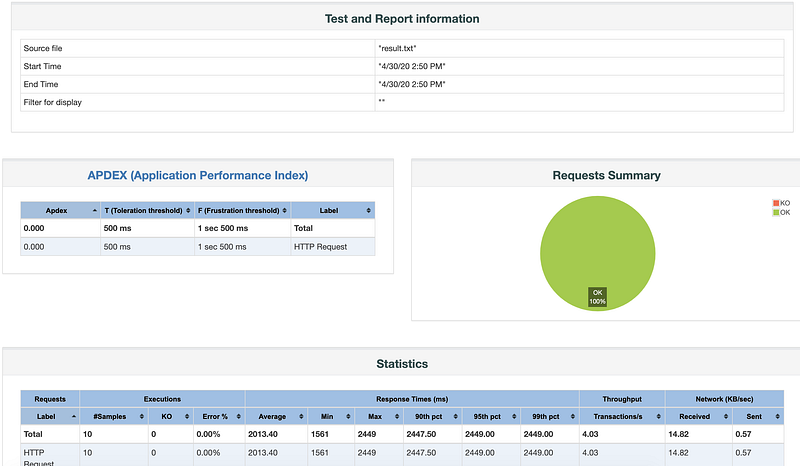
To get a detailed report, you can run the test plan using the JMeter command-line utility:
jmeter -n -t APITestPlan.jmx -l result.txt -e -o reports/Here APITestPlan.jmx is the test plan I created in the previous step. result.txtis the file in which test results will be stored, and reports is the folder in which the HTML reports will be created. If you open the reports/index.html page, you will be shown very intuitive results:
You can add complexity to your tests as per business needs.
Taurus
Taurus is an open-source automation framework for running various open-source load-testing tools and functional-testing tools. For regular automated test runs, you need only stick to using Apache JMeter. But if you plan to do continuous testing, then you need to use a tool like Taurus that runs the load tests and produce results in a common format like JUnit results.
Installing Taurus is easy. You can look at the details on the installation page.
pip install --upgrade pip wheel
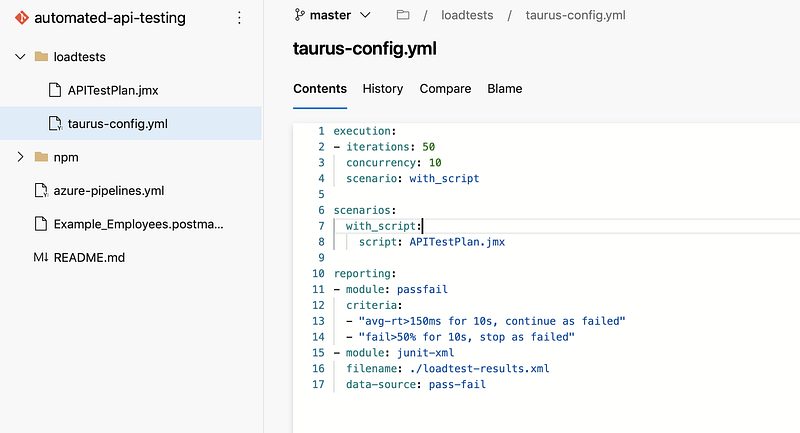
pip install bztOnce the installation is done, you need to create a configuration file taurus-config.yml, as shown below:
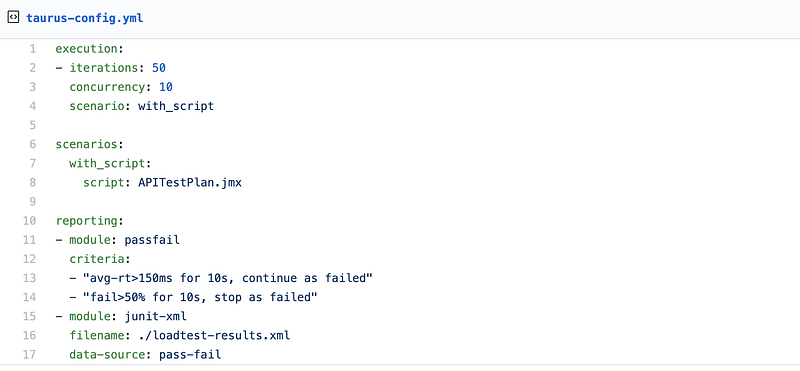
In the above script, you need to give the path of the JMeter test plan. Here you need the report in the JUnit format so that you can use the test results and upload those to the DevOps platform. There are other reporting options also available in the Taurus that you may want to explore.
To check if everything is fine, you can run the Taurus command line, as shown below:
bzt taurus-config.yml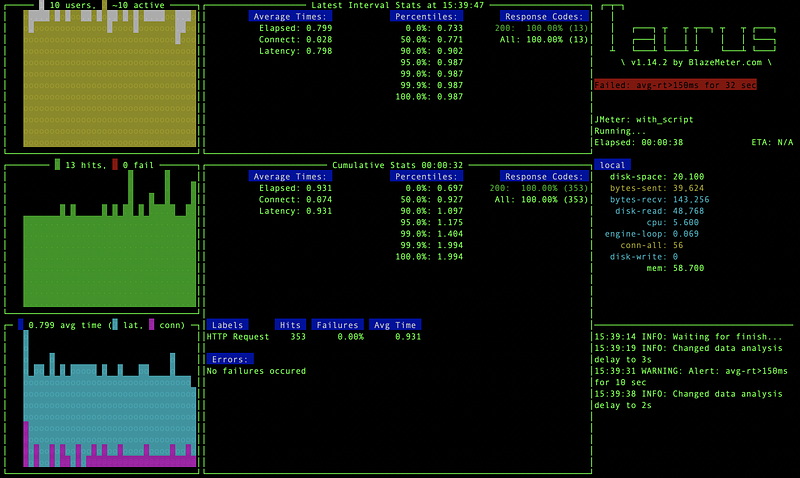
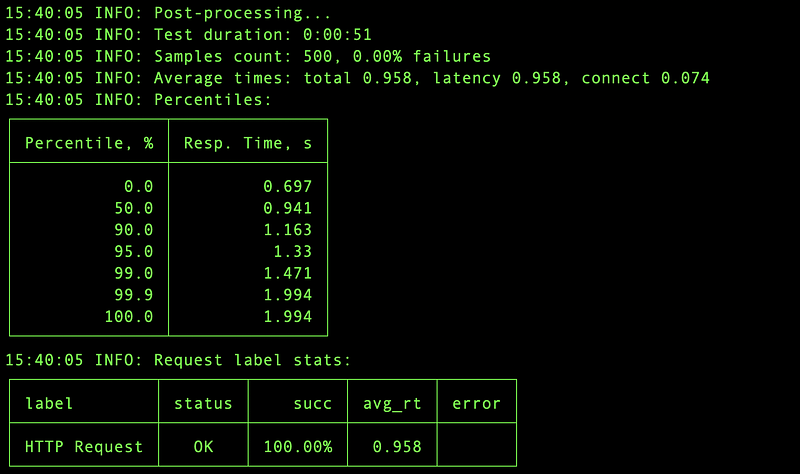
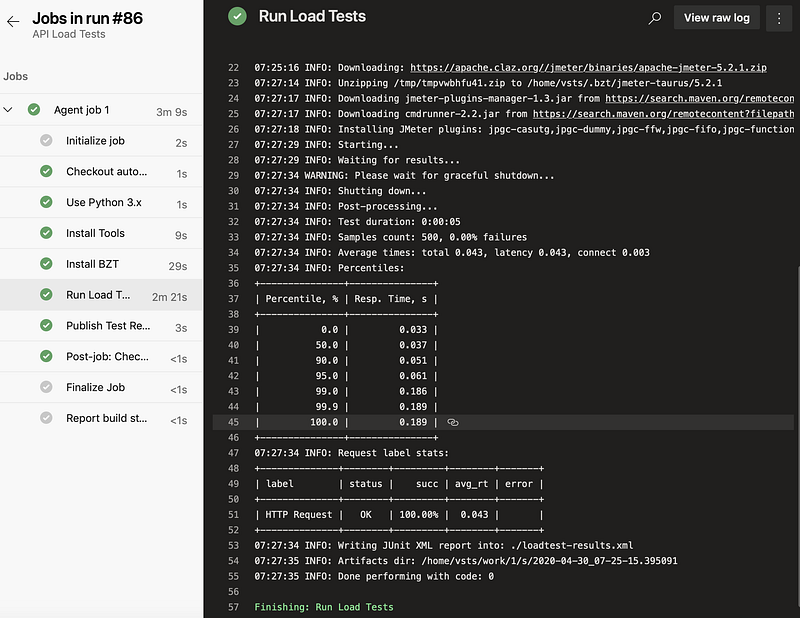
Post-run, you will be able to see the detailed reports on the command line, as shown below:
Integrate with Azure DevOps
Now that you are able to execute the tests on your PC/Laptop, it’s time to integrate these into the continuous testing pipelines.
For this, you need to commit the Taurus config file as well as the Apache JMeter test plan file to a Git repo.
Next, you need to create a pipeline, which consists of the following steps:
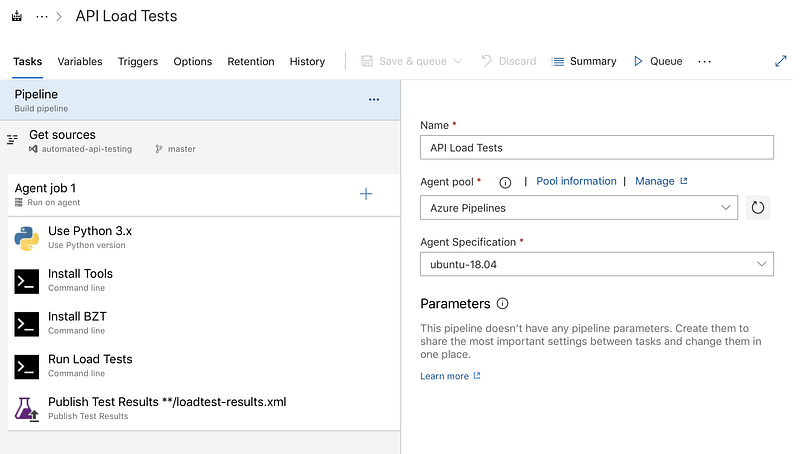
Here I am using the Azure DevOps hosted agent. If you are using your own agent, then you don’t need to install the pre-requisites on every pipeline run.
- Use Python — In this step, you are telling the agent that we need to use Python 3.x.
- Install tools — In this step, you are installing the Python tools that will be useful for installing the other tools.
python -m pip install --upgrade pip setuptools wheel3. Install BZT — In this step, you are installing the Taurus tool.
pip install bzt4. Run load tests — In this step, you are running the actual load test and gathering results.
bzt loadtests/taurus-config.yml
On a successful run, step 4 will produce an XML file in JUnit format.
Note that Taurus downloads the Apache JMeter binaries if not installed already.
5. Publish test results — In this step, you are publishing the test results to the Azure DevOps test plan. Here you need to give the file name used for writing down the results in JUnit format.
Run the Pipeline
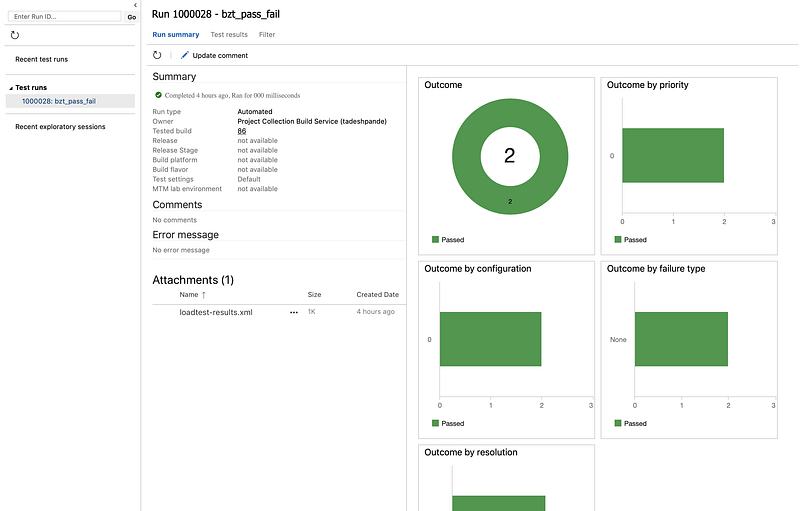
Once you have completed the above-mentioned steps, you need to run the pipeline. On successful execution, you will the results of the pipeline, as shown below:
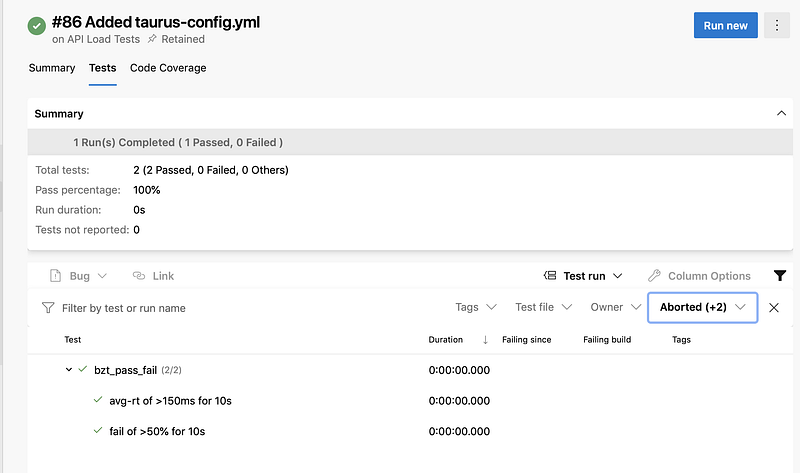
As a result of the last step, the test results will also be published in the Azure DevOps test plan.
Hey, if you enjoyed this story, check out Medium Membership! Just $5/month!Your membership fee directly supports me and other writers you read. You’ll also get full access to every story on Medium.