
A Deeper Look at NVIDIA KST Algo-Trading Signals & Backtesting

- Referring to the previous fundamental/technical analysis and Macroaxis reviews of the NVIDIA stock price, we will take a deeper look at algo-trading signals and backtesting of this chipmaker using most popular technical indicators in Python.
- Headlines: NVIDIA Corp (NASDAQ: NVDA) is the worldwide leader in visual computing technologies and the inventor of the GPU. NVIDIA’s dominance in the AI market is quite evident, with ca. 90% of the GPU market for ultra-advanced computing applications under their control. The company’s success in AI has contributed significantly to its current stock growth. The company registered a massive 206% increase in Q3 revenue.
- As of March 2024 NVIDIA has a market cap of $2.285 Trillion. This makes NVIDIA the world’s third most valuable company by market cap according to the Global ranking data.
- Zacks’ proprietary data indicates that NVDA is currently rated as a Zacks Rank 1 (Strong Buy). Valuation metrics show that NVDA may be overvalued. Its Value Score of F indicates it would be a bad pick for value investors.
- The current NVDA Sharpe ratio is 5.30 (cf. the ^GSPC Sharpe ratio is 2.65). A Sharpe ratio of 3.0 or higher is considered excellent.
- The current NVDA volatility is 19.19%, whereas the ^GSPC volatility is 3.31
- Macroaxis Report: the Jensen Alpha is 0.722, the Sortino ratio is 0.3906, and the Treynor ratio 0.4888, the skewness is 1.9, and the kurtosis is 8.76.
- Let’s compare several algo-trading strategies and somewhat advanced technical indicators that supplement a more traditional technical analysis when analyzing NVDA investment/trading opportunities during 2021–2024.
KST Trading Strategy
- Developed by Martin Pring, Know Sure Thing (KST) is a momentum oscillator based on the smoothed rate-of-change for four different timeframes.
- The KST indicator uses in its calculation the Rate of Change (ROC) indicator. The ROC indicator measures the strength of price momentum.
- Pros: The KST is a flexible tool that traders may use to help them spot market trends, time momentum shifts for when to enter and exit, and spot divergences that could be signs of impending reversals.
- Cons: The KST has drawbacks, including the ability to provide misleading signals, and its intricacy could be difficult for inexperienced traders to understand.
- Let’s follow the complete guide & code on using and implementing the KST indicator in Python.
import os
os.chdir('YOURPATH')    # Set working directory
os. getcwd()

# IMPORTING PACKAGES

import pandas as pd
import numpy as np
import requests
import matplotlib.pyplot as plt
from math import floor
from termcolor import colored as cl

plt.style.use('fivethirtyeight')
plt.rcParams['figure.figsize'] = (20,10)

# EXTRACTING STOCK DATA

def get_historical_data(symbol, start_date):
    api_key = 'your_api_key'
    api_url = f'https://api.twelvedata.com/time_series?symbol={symbol}&interval=1day&outputsize=5000&apikey={api_key}'
    raw_df = requests.get(api_url).json()
    df = pd.DataFrame(raw_df['values']).iloc[::-1].set_index('datetime').astype(float)
    df = df[df.index >= start_date]
    df.index = pd.to_datetime(df.index)
    return df

aapl = get_historical_data('NVDA', '2021-01-01')
aapl.to_csv('nvdastock2021-2024.csv', index=True)
#aapl

# ROC CALCULATION

def get_roc(close, n):
    difference = close.diff(n)
    nprev_values = close.shift(n)
    roc = (difference / nprev_values) * 100
    return roc

  # KST CALCULATION

def get_kst(close, sma1, sma2, sma3, sma4, roc1, roc2, roc3, roc4, signal):
    rcma1 = get_roc(close, roc1).rolling(sma1).mean()
    rcma2 = get_roc(close, roc2).rolling(sma2).mean()
    rcma3 = get_roc(close, roc3).rolling(sma3).mean()
    rcma4 = get_roc(close, roc4).rolling(sma4).mean()
    kst = (rcma1 * 1) + (rcma2 * 2) + (rcma3 * 3) + (rcma4 * 4)
    signal = kst.rolling(signal).mean()
    return kst, signal

aapl['kst'], aapl['signal_line'] = get_kst(aapl['close'], 10, 10, 10, 15, 10, 15, 20, 30, 9)
aapl = aapl[aapl.index >= '2021-01-01']
#aapl.tail()

# KST INDICATOR PLOT

ax1 = plt.subplot2grid((11,1), (0,0), rowspan = 5, colspan = 1)
ax2 = plt.subplot2grid((11,1), (6,0), rowspan = 5, colspan = 1)
ax1.plot(aapl['close'], linewidth = 2.5)
ax1.set_title('NVDA CLOSING PRICES')
ax2.plot(aapl['kst'], linewidth = 2, label = 'KST', color = 'orange')
ax2.plot(aapl['signal_line'], linewidth = 2, label = 'SIGNAL', color = 'mediumorchid')
ax2.legend()
ax2.set_title('NVDA KST')
plt.show()

# KST CROSSOVER TRADING STRATEGY

def implement_kst_strategy(prices, kst_line, signal_line):
    buy_price = []
    sell_price = []
    kst_signal = []
    signal = 0

    for i in range(len(kst_line)):

        if kst_line[i-1] < signal_line[i-1] and kst_line[i] > signal_line[i]:
            if signal != 1:
                buy_price.append(prices[i])
                sell_price.append(np.nan)
                signal = 1
                kst_signal.append(signal)
            else:
                buy_price.append(np.nan)
                sell_price.append(np.nan)
                kst_signal.append(0)

        elif kst_line[i-1] > signal_line[i-1] and kst_line[i] < signal_line[i]:
            if signal != -1:
                buy_price.append(np.nan)
                sell_price.append(prices[i])
                signal = -1
                kst_signal.append(signal)
            else:
                buy_price.append(np.nan)
                sell_price.append(np.nan)
                kst_signal.append(0)

        else:
            buy_price.append(np.nan)
            sell_price.append(np.nan)
            kst_signal.append(0)

    return buy_price, sell_price, kst_signal

buy_price, sell_price, kst_signal = implement_kst_strategy(aapl['close'], aapl['kst'], aapl['signal_line'])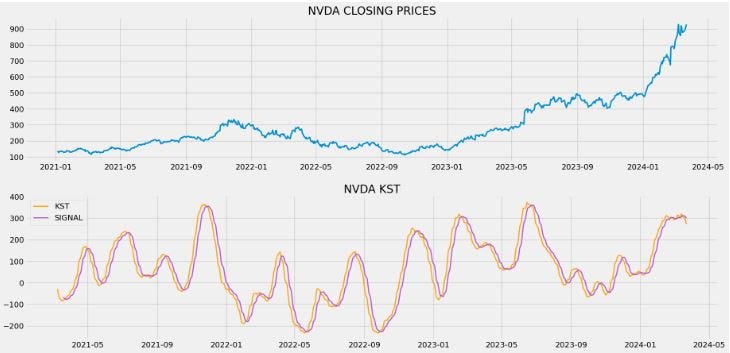
# TRADING SIGNALS PLOT

ax1 = plt.subplot2grid((11,1), (0,0), rowspan = 5, colspan = 1)
ax2 = plt.subplot2grid((11,1), (6,0), rowspan = 5, colspan = 1)
ax1.plot(aapl['close'], linewidth = 2, label = 'aapl')
ax1.plot(aapl.index, buy_price, marker = '^', markersize = 12, linewidth = 0, color = 'green', label = 'BUY SIGNAL')
ax1.plot(aapl.index, sell_price, marker = 'v', markersize = 12, linewidth = 0, color = 'r', label = 'SELL SIGNAL')
ax1.legend()
ax1.set_title('NVDA KST TRADING SIGNALS')
ax2.plot(aapl['kst'], linewidth = 2, label = 'KST', color = 'orange')
ax2.plot(aapl['signal_line'], linewidth = 2, label = 'SIGNAL', color = 'mediumorchid')
ax2.legend()
ax2.set_title('NVDA KST')
plt.show()
# STOCK POSITION
position = []
for i in range(len(kst_signal)):
if kst_signal[i] > 1:
position.append(0)
else:
position.append(1)
for i in range(len(aapl['close'])):
if kst_signal[i] == 1:
position[i] = 1
elif kst_signal[i] == -1:
position[i] = 0
else:
position[i] = position[i-1]
close_price = aapl['close']
kst = aapl['kst']
signal_line = aapl['signal_line']
kst_signal = pd.DataFrame(kst_signal).rename(columns = {0:'kst_signal'}).set_index(aapl.index)
position = pd.DataFrame(position).rename(columns = {0:'kst_position'}).set_index(aapl.index)
frames = [close_price, kst, signal_line, kst_signal, position]
strategy = pd.concat(frames, join = 'inner', axis = 1)
#strategy
#STOCK DAILY & CUMULATIVE RETURNS
rets = aapl.close.pct_change().dropna()
strat_rets = strategy.kst_position[1:]*rets
plt.title('Daily Returns')
rets.plot(color = 'blue', alpha = 0.3, linewidth = 7)
strat_rets.plot(color = 'r', linewidth = 1)
plt.show()
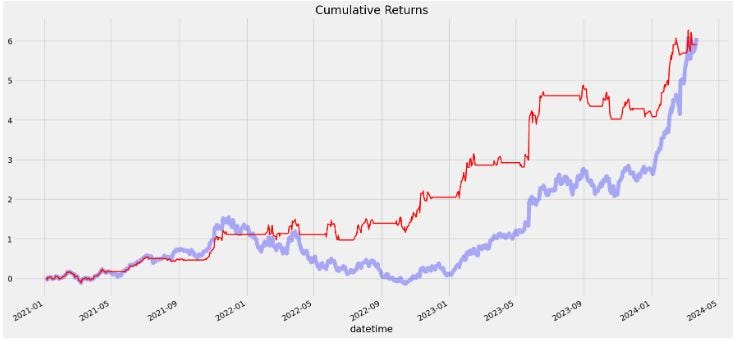
rets_cum = (1 + rets).cumprod() - 1
strat_cum = (1 + strat_rets).cumprod() - 1
plt.title('Cumulative Returns')
rets_cum.plot(color = 'blue', alpha = 0.3, linewidth = 7)
strat_cum.plot(color = 'r', linewidth = 2)
plt.show()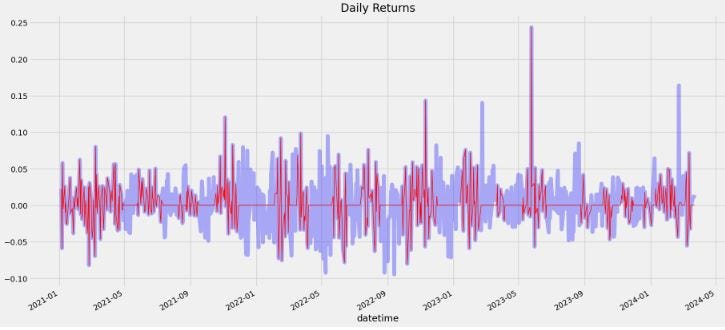
# BACKTESTING

tsla_ret = pd.DataFrame(np.diff(tsla['close'])).rename(columns = {0:'returns'})
kst_strategy_ret = []

for i in range(len(tsla_ret)):
    returns = tsla_ret['returns'][i]*strategy['kst_position'][i]
    kst_strategy_ret.append(returns)

kst_strategy_ret_df = pd.DataFrame(kst_strategy_ret).rename(columns = {0:'kst_returns'})
investment_value = 10000
number_of_stocks = floor(investment_value/tsla['close'][0])
kst_investment_ret = []

for i in range(len(kst_strategy_ret_df['kst_returns'])):
    returns = number_of_stocks*kst_strategy_ret_df['kst_returns'][i]
    kst_investment_ret.append(returns)

kst_investment_ret_df = pd.DataFrame(kst_investment_ret).rename(columns = {0:'investment_returns'})
total_investment_ret = round(sum(kst_investment_ret_df['investment_returns']), 2)
profit_percentage = floor((total_investment_ret/investment_value)*100)
print(cl('Profit gained from the KST strategy by investing $10k in NVDA : {}'.format(total_investment_ret), attrs = ['bold']))
print(cl('Profit percentage of the KST strategy : {}%'.format(profit_percentage), attrs = ['bold']))
Profit gained from the KST strategy by investing $10k in NVDA : 35843.5
Profit percentage of the KST strategy : 358%# SPY ETF COMPARISON
def get_benchmark(start_date, investment_value):
spy = get_historical_data('SPY', start_date)['close']
benchmark = pd.DataFrame(np.diff(spy)).rename(columns = {0:'benchmark_returns'})
investment_value = investment_value
number_of_stocks = floor(investment_value/spy[-1])
benchmark_investment_ret = []
for i in range(len(benchmark['benchmark_returns'])):
returns = number_of_stocks*benchmark['benchmark_returns'][i]
benchmark_investment_ret.append(returns)
benchmark_investment_ret_df = pd.DataFrame(benchmark_investment_ret).rename(columns = {0:'investment_returns'})
return benchmark_investment_ret_df
benchmark = get_benchmark('2021-01-01', 10000)
investment_value = 10000
total_benchmark_investment_ret = round(sum(benchmark['investment_returns']), 2)
benchmark_profit_percentage = floor((total_benchmark_investment_ret/investment_value)*100)
print(cl('Benchmark profit by investing $10k : {}'.format(total_benchmark_investment_ret), attrs = ['bold']))
print(cl('Benchmark Profit percentage : {}%'.format(benchmark_profit_percentage), attrs = ['bold']))
print(cl('KST Strategy profit is {}% higher than the Benchmark Profit'.format(profit_percentage - benchmark_profit_percentage), attrs = ['bold']))Benchmark profit by investing $10k : 2893.22
Benchmark Profit percentage : 28%
KST Strategy profit is 330% higher than the Benchmark ProfitKST Takeaways:
- When the KST crosses the zero line (e.g. Q4 ‘23), traders frequently search for “crossings” since these can indicate possible buy or sell opportunities.
- A buy signal is triggered when the KST crosses above the zero line. If the KST moving averages hold above the zero line, a bullish trend is confirmed. A sell signal is triggered when the KST crosses below the zero line. If the KST moving averages hold below the zero line, a bearish trend is confirmed.
- Risk management is a crucial aspect of any successful trading strategy. That’s where the KST Indicator shines. By providing reliable signals of potential trend reversals, the KST Indicator helps traders manage their risk effectively.
Conclusion
- This work has investigated the backtesting and benchmarking effects of using the KST moving averages for NVIDIA algo-trading in greater detail.
- The findings indicate favorable results in using the KST trading strategies to maximize the NVIDIA stock market cumulative return whilst minimizing investment risks.
- The future work will focus on the pertinent integration of KST with other trading indicators to optimize the advantages of each.
References
- Nvidia Stock Technical Analysis
- Algorithmic Trading with the Know Sure Thing indicator in Python
- The Ultimate Guide to the KST Indicator: How to Use and Interpret
- Getting rid of confusion: Mastering the indicator of Know Sure Thing
Explore More
- A Market-Neutral Strategy
- A Comprehensive Analysis of Best Trading Technical Indicators w/ TA-Lib
- IQR-Based Log Price Volatility Ranking of Top 19 Blue Chips
- NVIDIA Rolling Volatility: GARCH & XGBoost
- NVIDIA Returns-Drawdowns MVA & RNN Mean Reversal Trading
- Returns-Volatility Domain K-Means Clustering and LSTM Anomaly Detection of S&P 500 Stocks
- Dividend-NG-BTC Diversify Big Tech


