A Comprehensive Guide: Monitoring Websites in Zabbix for Enhanced Availability and Performance
In today’s digital landscape, website availability and performance are crucial for businesses to deliver optimal user experiences. Zabbix, a robust open-source monitoring solution, provides powerful capabilities to monitor websites and ensure their smooth operation. In this blog, we will walk you through the process of monitoring websites in Zabbix, helping you gain valuable insights, identify issues proactively, and optimize your website’s performance.
Hope are you running Zabbix server 6. x or above.
Note: For new Zabbix Server installation check out this: https://github.com/karthick-dkk/zabbix
Setting Up Website Monitoring in Zabbix: To begin monitoring websites in Zabbix, follow these steps:
→ Create a Template for Website Monitor
→ Create a trigger for alerts
→ Install Zabbix agent2 on any system or server.
→ Create a new host with created template and add the website
→ Create Dashboard for a website monitor
1. How to Create a Template Setup for Website Monitor?
If you are running Zabbix server version 6.x or above, check the template name called “Website certificate by Zabbix agent 2”
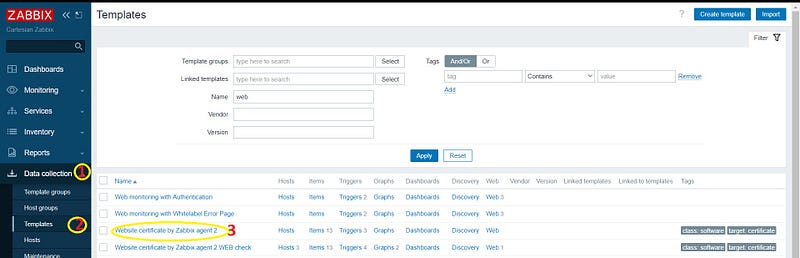
You can edit the same template or make a Full clone of this template and modify your own.
Here I modified the template name as “Website certificate by Zabbix agent 2 WEB check”
Once you make a full clone,follow the below steps.
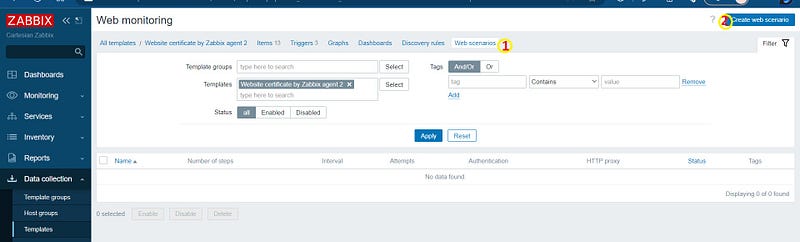
- a. Create a new web scenario (To check the website status):
Enable web monitoring: Enable the Zabbix web monitoring feature for the host. This feature allows Zabbix to perform HTTP checks on the website.
Define web scenarios: Set up web scenarios to simulate user interactions and monitor specific website functionalities. This involves defining steps, expected responses, and conditions for success or failure.
- Open the template and go to the web scenario
- Create a New web scenario by clicking “Create Web Scenario”
- Next, Enter the below details
Name: Web Health Check
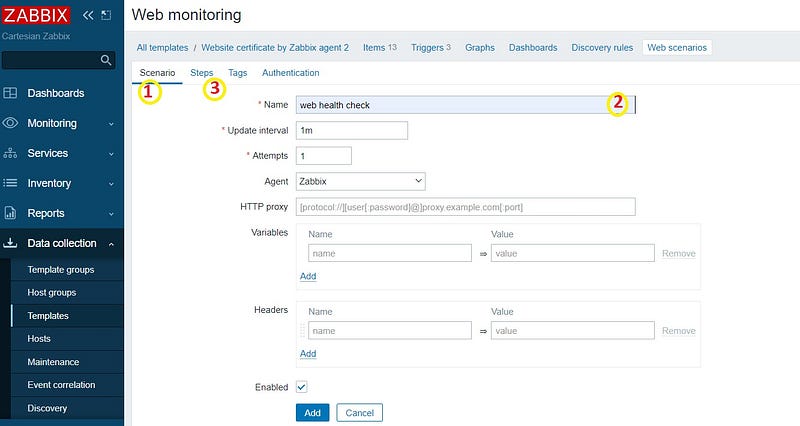
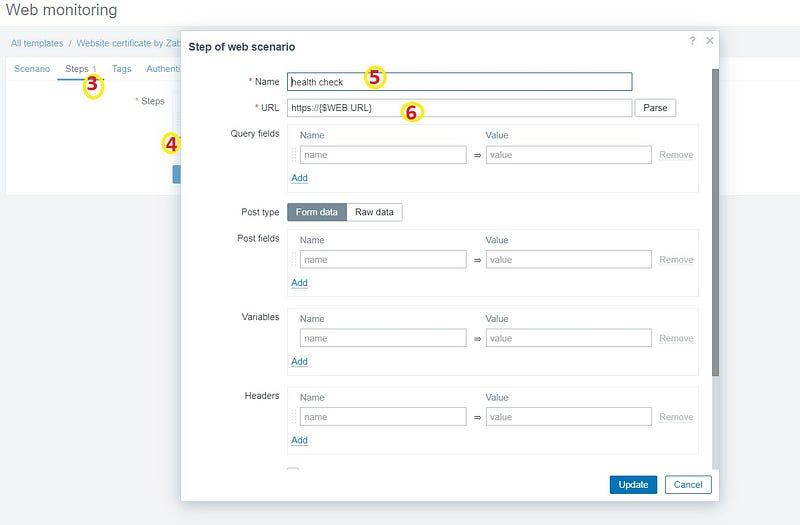
Go to the “Steps” Tab and add new steps
Name: health check
URL: https://{$WEB.URL}
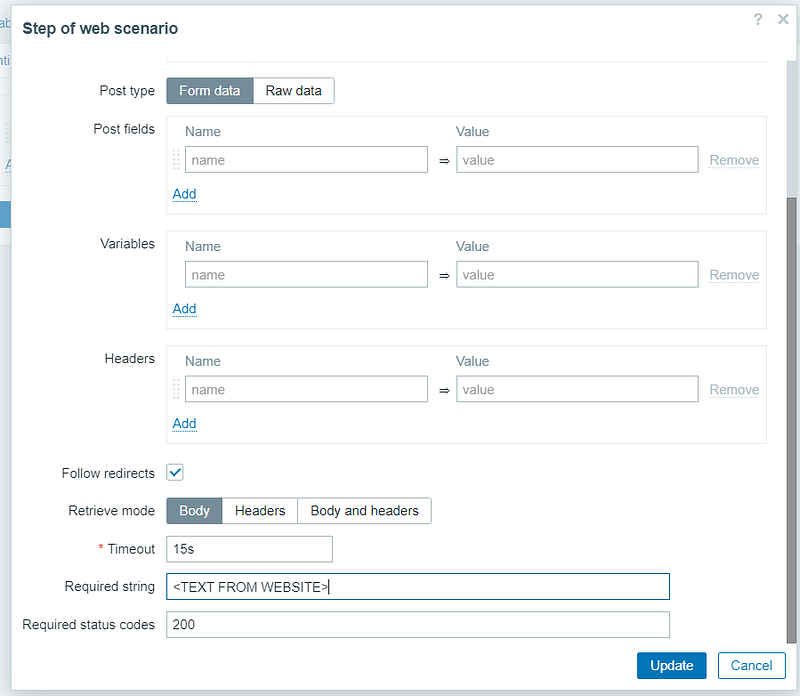
Follow Redirects: checked
Retrieve mode: Body
Request String:
[ Note: use curl
Require status codes: 200
Monitoring HTTP status codes helps detect issues that could impact website availability. Zabbix allows you to monitor and trigger alerts based on specific HTTP status codes, such as 200 (OK), 404 (Not Found), or 500 (Internal Server Error). By monitoring these codes, you can quickly identify errors and take necessary actions to resolve them.
Then click “Add”.
Ensure that your website’s content is accurate and functioning as expected by implementing content validation in Zabbix. This involves defining expected content patterns or regular expressions and verifying their presence in the website’s response. If the expected content is missing, Zabbix triggers an alert, indicating a potential issue with the website.
2. How To Create a New Trigger?
(Why Trigger: If the website is down will receive alerts)
Define triggers and actions: Configure triggers based on predefined thresholds or conditions, and associate actions to notify relevant parties when an issue arises.
Now Go to the Trigger tab and create a new trigger
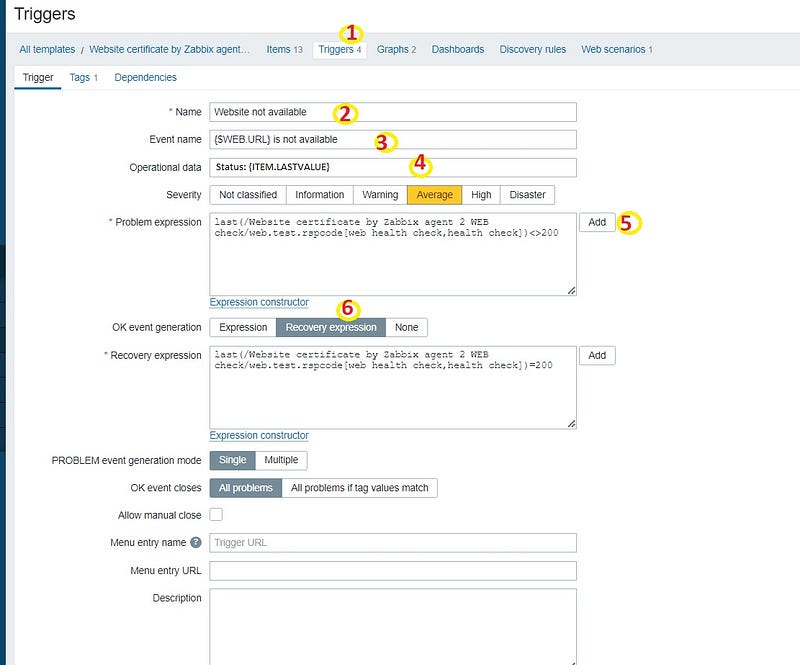
Name: Website not available
Event Name: {$WEB.URL} is not available
Operational data: Status: {ITEM.LASTVALUE}
Choose Severity : Average ( based on your priority)
Problem expression
Click Add and now click Select on item check box.
Choose the response code for step “health check” of scenario “web health check”. ( It will show the name you entered in previous steps)
Now click Result <> 200
You will see output something like below:
Problem expression:
last(/Website certificate by Zabbix agent 2 WEB check/web.test.rspcode[web health check,health check])<>200
Ok Event generation: choose Recovery expression
Now copy same thing above( Problem expression) and modify = 200
Recovery expression:
last(/Website certificate by Zabbix agent 2 WEB check/web.test.rspcode[web health check,health check])=200
Now click Add. we have now created the alerts for our web check.
Configure Zabbix to send notifications when website monitoring triggers are activated. Set up email notifications, integrate with popular messaging platforms like Slack, or use other methods to ensure that the right people are promptly informed when issues arise. This allows for swift response and minimizes website downtime.
For your easy solutions no need to follow all the above steps above,
You can directly import the same template from below: https://github.com/karthick-dkk/zabbix/blob/main/zbx_website_monitor_template.yaml
2. a. How to import a template to Zabbix?
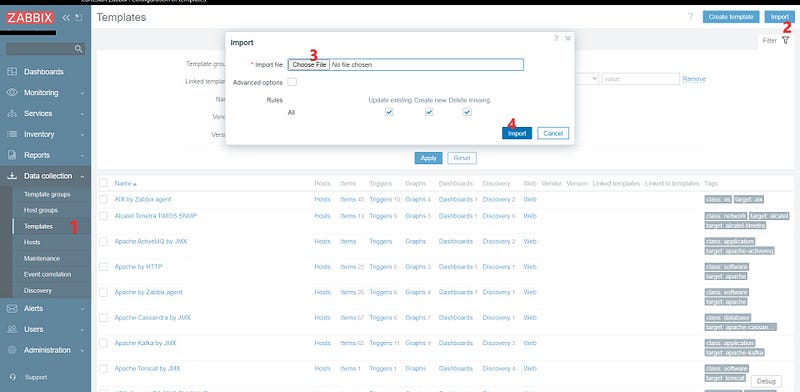
- Go to the template page
- click Import option
- Now click Choose File and select the Template file
- Now click Import.
Now you need to install Zabbix Agent 2 on your Zabbix server.
3. How to install Zabbix Agent2?
Check out this link for installation instructions: https://www.zabbix.com/download
Install on Centos 7 machines:
# rpm -Uvh https://repo.zabbix.com/zabbix/6.4/rhel/7/x86_64/zabbix-release-6.4-1.el7.noarch.rpm
# yum clean all
# yum install zabbix-agent2 zabbix-agent2-plugin-*
# systemctl restart zabbix-agent2
# systemctl enable zabbix-agent2
Once agent installed
Edit the zabbix_agent2.conf on /etc/zabbix/ to check the below parameters are correct.
#vim /etc/zabbix/zabbix_agent2.conf
Liste_Port =10050
Server=127.0.0.1
in this tutorial, we are installing the Zabbix agent2 on the Zabbix server.
4. How to Create a Host?
- Go to Data collections → Hosts( For old versions Configuration →hosts)
- Now click Create a Host
- Enter below details
Host Name: google.com [ enter your website ]
Visible Name: Google [ Any name ]
Templates: Website certificate by Zabbix agent 2 WEB check
Host groups: web
Interfaces: 127.0.0.1
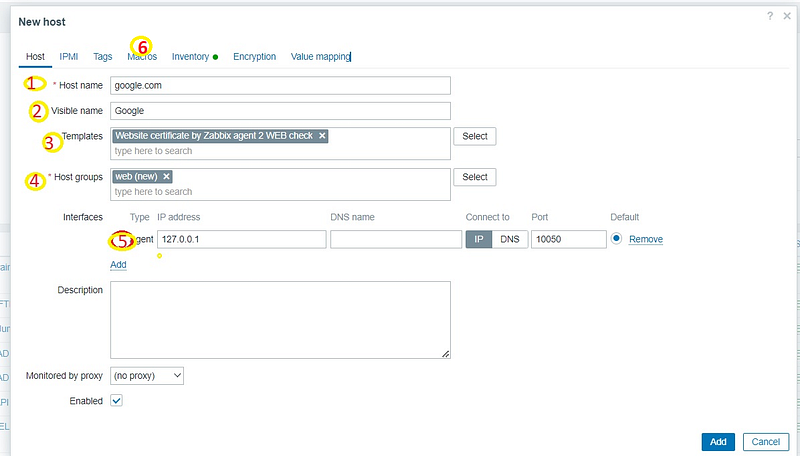
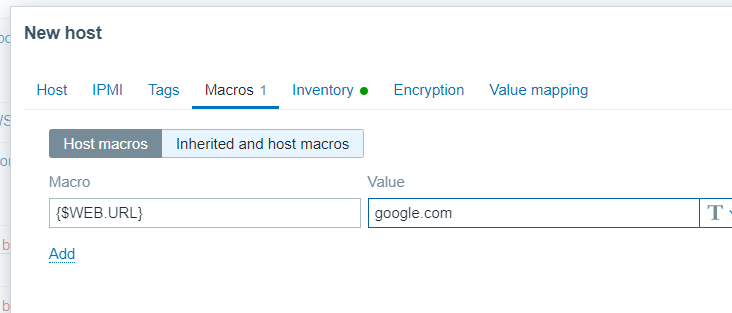
- Now go to the macro Tab and Click Inherited and Host macros
- Find a macro called {$WEB.URL}
- edit the value as your web_site name.
Then add the host.
How to Create Dashboard?
Go to Monitor →All Dashboards → Create New Dashboard
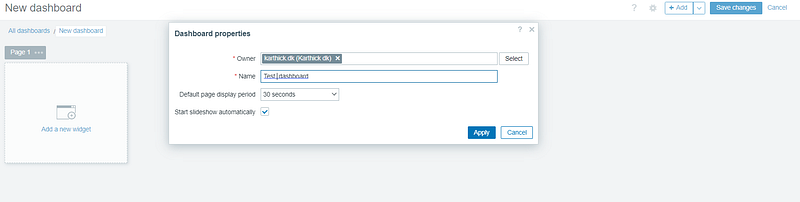
Once the dashboard is created Add a new Widget and choose like below
Website Monitor widget:
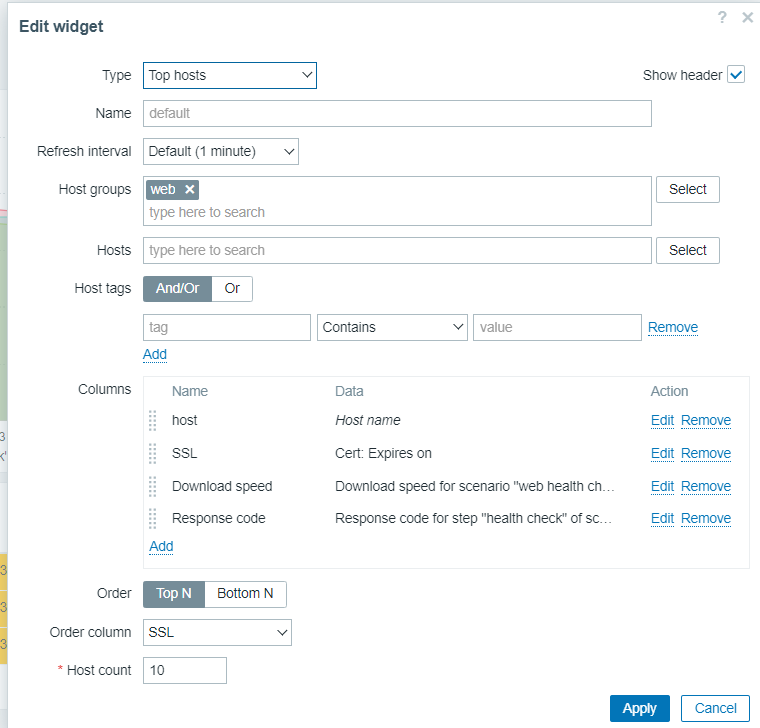
In columns click Add and mention like below
For items choose Select → Choose the items
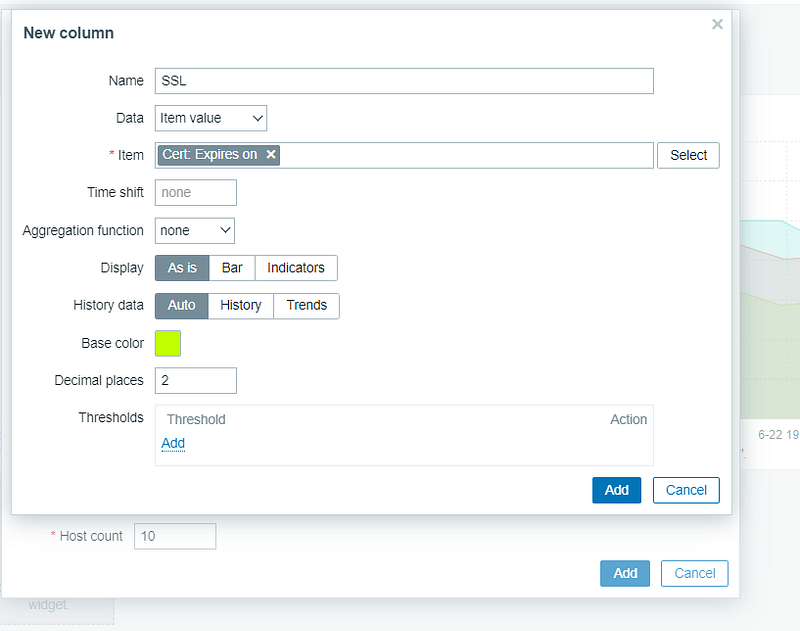
Like Add, SSL, Hostname, and Download speed.
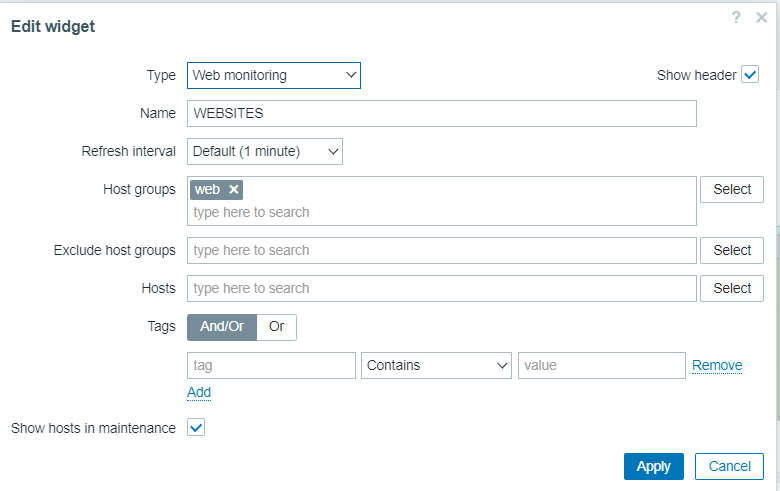
Next, Add a New widget , then mention like below:
Web Monitoring widget:
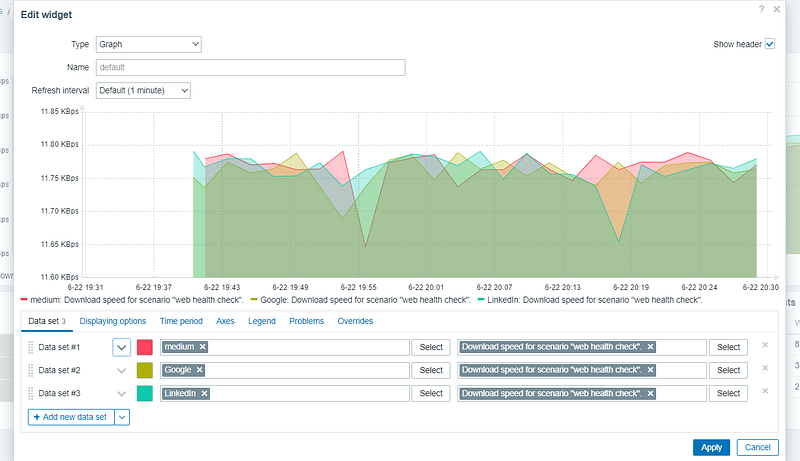
Next Add a new widget and mention like below:
Download Speed of Websites:
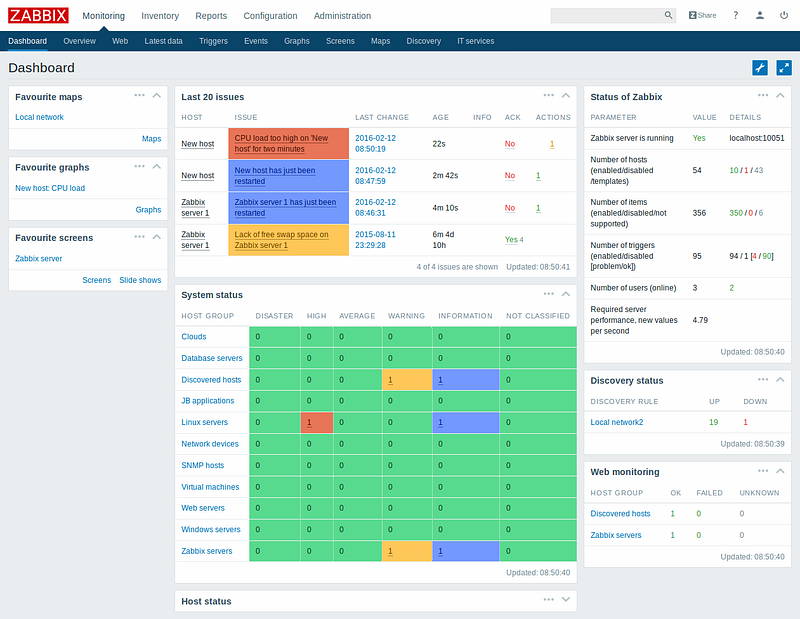
- Now we added all the required configs for monitoring the websites.
- Now you can see the Dashboard below.
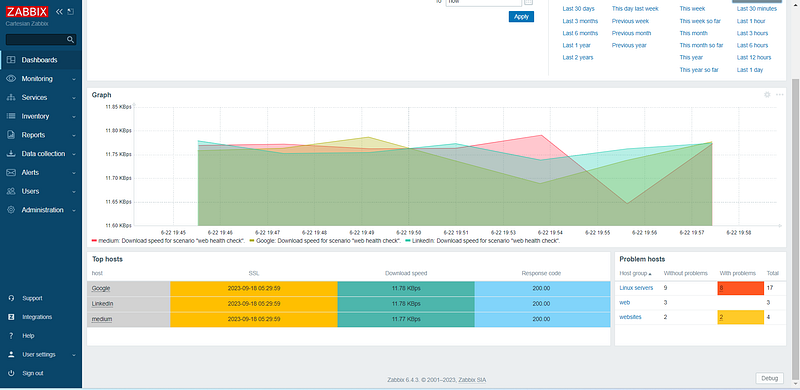
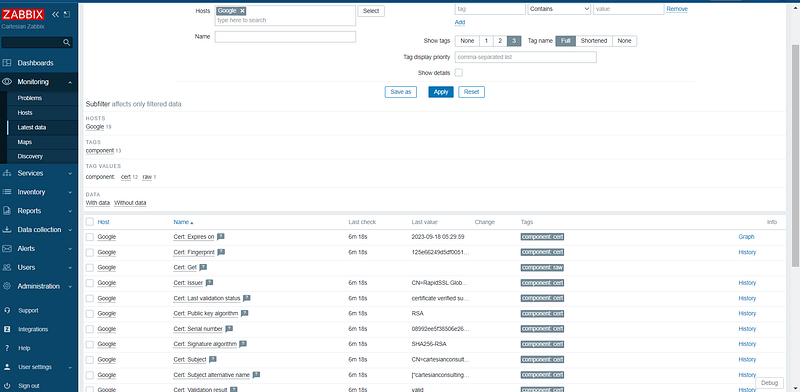
Note: For more data from the websites go-to Latest data and Check for Host: Google
Reporting and Analysis: Zabbix provides reporting and analysis features to gain deeper insights into website monitoring data. Utilize these capabilities to generate reports, perform trend analysis, and identify long-term performance patterns. This information is valuable for capacity planning, identifying areas for improvement, and optimizing your website’s overall performance.
Thanks for your time,I hope you will get some idea.
Follow for More 👉 Medium — https://medium.com/@karthidkk123 Linked In — https://www.linkedin.com/in/karthick-dkk/ Instagram — https://www.instagram.com/karthick_dkk_dk/