
A Comparison of Holt Winters vs ARIMA When Predicting on Female Births in California

Two very common time series models are the Holt Winters and the ARIMA methods.
The Holt Winters method is a simple time series forecasting method to use because it utilises triple exponential smoothing that is built into the method. Therefore, a time series must have trend and seasonality in it in order for this model to work.
ARIMA, on the other hand, must be detrended and de-seasoned before it will work in the manner that it should. The ARIMA model has three components in it, being:-
- Autoregression,
- Moving average, and
- Integration (or differencing).
I decided to conduct an experiment to find out which model works better on the California female births dataset, in which the data was gathered in the year 1959.
I have written the program for this experiment in Google Colab, which is a free online Jupyter Notebook that is hosted by Google. Google Colab is a great website, with the only drawback being the fact it does not have a proper undo function. The only type of undo function that this program has is to undo a deleted cell. Therefore, care needs to be taken not to delete or overwrite valuable code.
After I created the program that I would need to perform this experiment, I installed the most current libraries and imported them. Another niggle that I have found with Google Colab is the fact that the program does not stay abreast of the most recent updates on the various Python libraries.
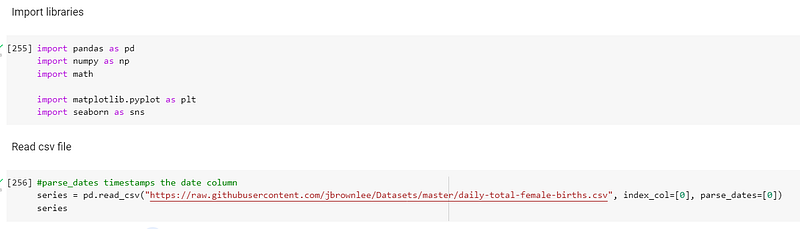
Once the most recent versions of the python libraries I would need were installed, I imported them into the program, being:-
- Pandas is used to process data by creating and maintaining dataframes,
- Numpy is used to make numerical computations and to create numpy arrays,
- Math is an inbuilt math library, used to perform mathematical computations at a higher level than simple basic math that is coded into Python,
- Statsmodels, which performs statistical and time series operations,
- Matplotlib is used to plot the data points onto a graph, and
- Seaborn is a higher level graphics package that plots graphs in a statistical fashion.
I then used pandas to read the time series csv file into the program. I timestamped and indexed the first column of the dataset:-
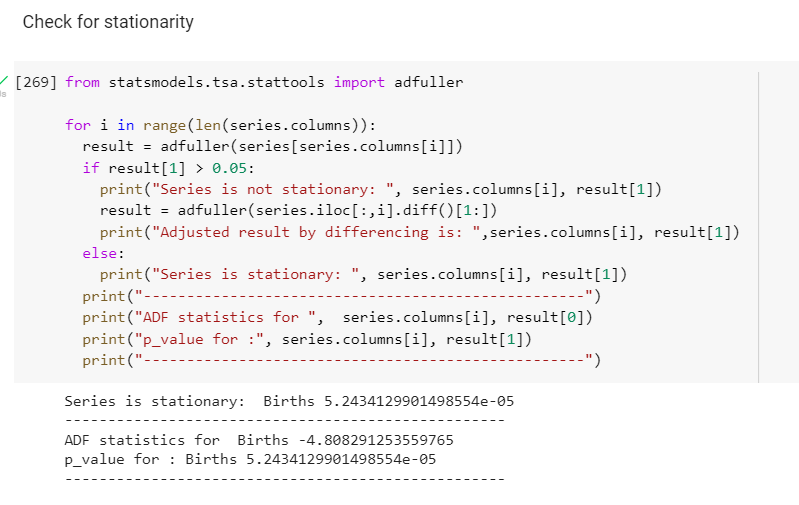
I then checked the time series for stationarity. A time series is stationary if the p-value is less than 0.05, and on this occasion it was:-
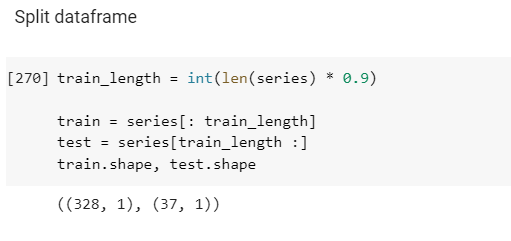
I then split the time series into training and validation sets:-
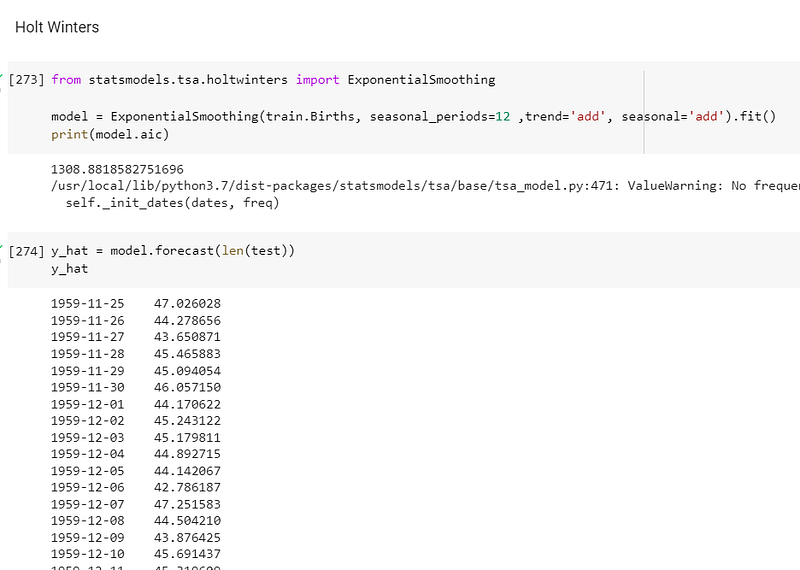
The first model I experimented on was the Holt Winters model because it provides triple exponential smoothing, which means the dataset does not need to be de-seasoned or de-trended before it is trained and fitted into the model.
After I trained and fitted the model, I checked akaike information criteria, or aic, because this value it incorporates the goodness of fit and simplicity/parsimony into a single statistic. In general, the lower this value is, the better.
I made a forecast of the model:-
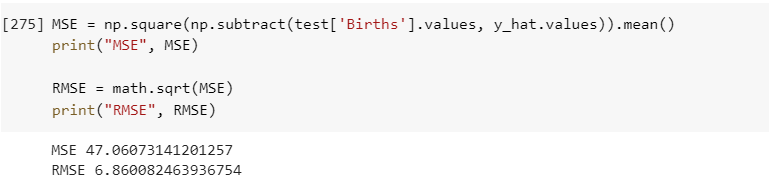
I checked the root mean squared error, or rmse, of the predictions and achieved an error of 6.86:-
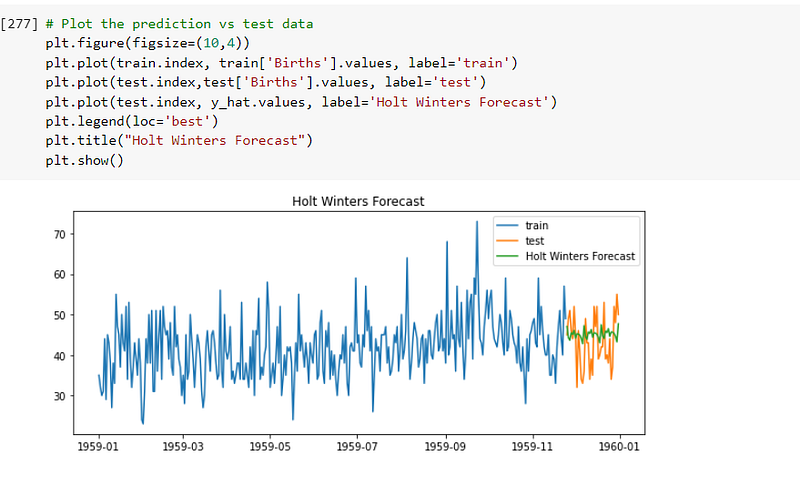
I plotted the predictions on a graph against the time series, and it can be seen in the screenshot below:-
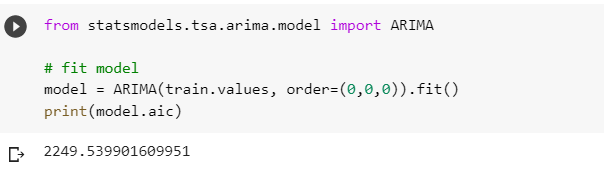
I then experimented with the time series using the ARIMA model. I noted that I had an aic measurement of 2249, being higher than Holt Winters’ reading:-
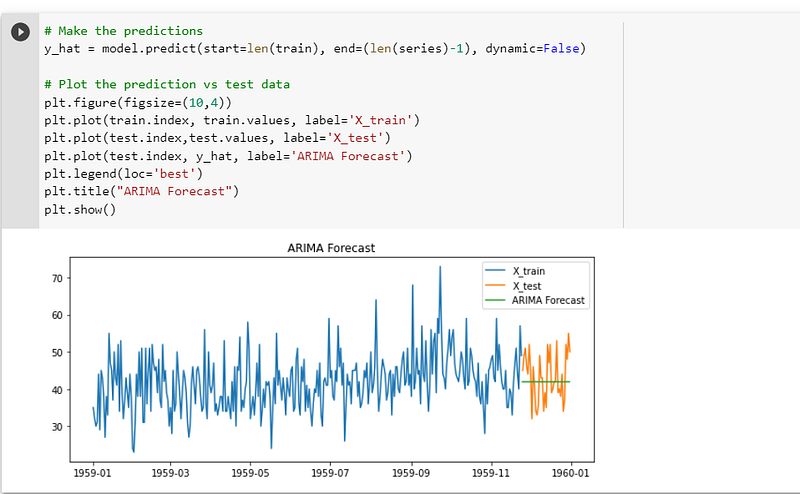
I made predictions on the trained and fitted model and plotted the results on a graph, as seen below:-
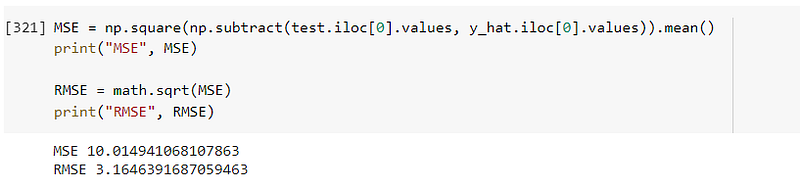
I then checked the rmse and found it is 3.16, which is about half the value of Holt Winters’ equivalent reading:-
In conclusion, we have a bit of a conundrum here because the aic measurement favours the Holt Winters model and the rmse favours ARIMA. I think that considering the fact that the time series is stationary and did not need to be de-trended or de-seasoned, I would opt for the ARIMA model. The reason for this is because the Holt Winters model is designed specifically for time series that have trending and seasonality that need exponentially smoothing.
I have prepared a code review to accompany this blog post, which can be viewed here:- https://www.youtube.com/watch?v=Me_z7zHL2yo
More content at PlainEnglish.io. Sign up for our free weekly newsletter. Follow us on Twitter and LinkedIn. Check out our Community Discord and join our Talent Collective.