avatarFaisal Khan

Free AI web copilot to create summaries, insights and extended knowledge, download it at here

2834

Abstract

/a> as the most robust model (<a href="https://arxiv.org/abs/1706.06083">Madry et al.</a>). This fact highlights just how far away we are from robust recognition models – even for simple handwritten digits.</p><p id="c3ca">In our <a href="https://arxiv.org/abs/1805.09190">recent paper</a>, we introduce a new concept to classify images robustly. The idea is very simple: if an image is classified as a seven, than it should contain roughly two lines – one shorter, one longer – that touch each other at one end. That’s a generative way to think about digits, which is pretty natural for humans and which allows us to easily spot the signal (the lines) even amidst large amounts of noise and perturbations. Having such a model should make it easy to classify the adversarial examples featured above into the correct class. Learning a generative model of digits (say zeros) is pretty straightforward (using a <a href="https://arxiv.org/abs/1606.05908">Variational Autoencoder</a>) and, in a nutshell, works as follows: we start from a latent space of nuisance variables (which might capture things like thickness or tilt of the digit and are learnt from the data) and generate an image using a neural network. We then show examples of handwritten zeros and train the network to produce similar ones. At the end of training, the network has learnt about the natural variations of handwritten zeros:</p><figure id="9127"><img src="https://cdn-images-1.readmedium.com/v2/resize:fit:800/1*Y6O2le5_-9PLg_n4iWN_6w.png"><figcaption>A generative model of zeros learns the typical variations of handwritten digits (right side).</figcaption></figure><p id="3e0c">We learn such a generative model for each digit. Then, when a new input comes along, we check which digit model can best approximate the new input. This procedure is typically called <i>analysis-by-synthesis</i>, because we <i>analyse</i> the content of the image according to the model that can best <i>synthesise</i> it. Standard feedforward networks, on the other hand, have no feedback mechanisms to check whether the input image really resembles the inferred class:</p><figure id="e38b"><img src="https://cdn-images-1.readmedium.com/v2/resize:fit:800/1*qfe00YnTC58Up5hOmVuC8g.png"><figcaption>Feedforward networks directly go from image to class and have no way to check that the classification makes sense. Our analysis-by-synthesis model checks what image features are present and classifies according to which class makes most sense.</figcaption></figure><p id="f1e5">That’s really the key difference: feedforward networks have no way to check their predictions, you have to trust them. Our analysis-by-synthesis model, on the other hand, looks whether certain image features are really present in the input before jumping to a conclusion.</p><p id="031b">We do not need a pe

Options

rfect generative model for this procedure to work. Our model of handwritten digits is certainly not perfect: look at the blurry edges. Nonetheless, our model can classify hand-written digits with high accuracy (99,0%) and its decisions make a lot of sense to humans. For example, the model will always signal low confidence on noise images, because they don’t look like any of the digits it has seen before. The images closest to noise that the analysis-by-synthesis model still classifies as digits with high confidence make a lot of sense to humans:</p><figure id="5507"><img src="https://cdn-images-1.readmedium.com/v2/resize:fit:800/1*fjhRFQkEFDMWuwwFv2tEaQ.png"><figcaption>We tried to synthesise unrecognisable images that are still classified as zeros with high confidence by our analysis-by-synthesis model. This is the best we got.</figcaption></figure><p id="b7c5">In the current state-of-the-art model by Madry et al. we found that minimal perturbations of clean digits are often sufficient to derail the classification of the model. Doing the same for our analysis-by-synthesis model yields strikingly different results:</p><figure id="f6b0"><img src="https://cdn-images-1.readmedium.com/v2/resize:fit:800/1*aedBhqczyEb_pd4y9ubzEg.png"><figcaption>Adversarial examples for the analysis-by-synthesis model. Can you guess what the original number was?</figcaption></figure><p id="7e30">Note that the perturbations make a lot of sense to humans and it is sometimes difficult to decide into which class the image should be classified. That’s exactly what we expect to happen for a robust classification model.</p><p id="5452">Our model has several other notable features. For example, the decisions of the analysis-by-synthesis model are much easier to interpret as one can directly see which features sway the model towards a particular decision. In addition, we can even derive some lower bounds of its robustness.</p><p id="7ce5">The analysis-by-synthesis model does not quite match human perception yet and there is still a long way to go (see the full analysis in our <a href="https://arxiv.org/abs/1805.09190">manuscript</a>). Nonetheless, we believe these results are extremely encouraging and we hope that our work will pave the way towards a new class of classification models that are accurate, robust and interpretable. We still have to learn a lot about these new models, least of all how to make inference more efficient and how to scale them to more complex data sets (like CIFAR or ImageNet). We are working hard to answer these questions and are looking forward to sharing more results with you in the future.</p><h2 id="7aaa">Towards the first adversarially robust neural network model on MNIST</h2><p id="284d">Lukas Schott, Jonas Rauber, Matthias Bethge, Wieland Brendel arXiv:1805.09190</p></article></body>

A Brief Introduction to Forex trading & technical setups

Some key statistics about the most liquid financial market in the World

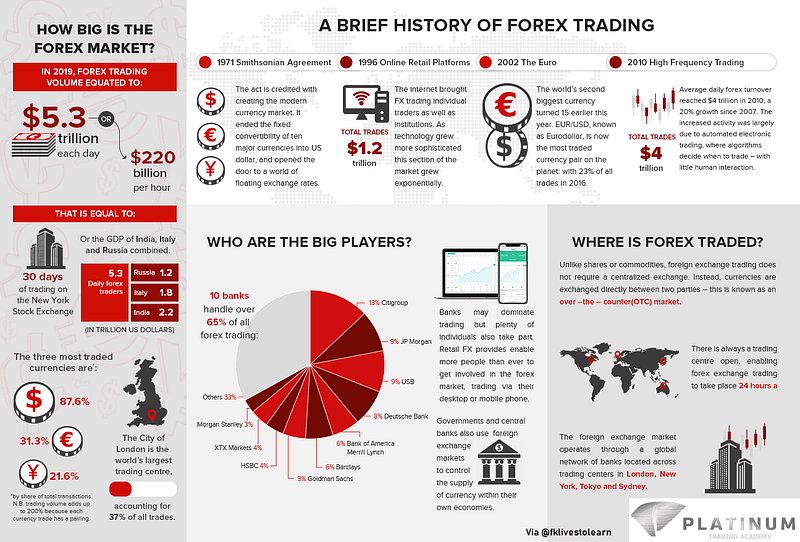
For most people, Foreign exchange means an exchange of one fiat currency for another when we are going to an overseas location for a vacation or a business trip to pay for goods or services. Still, for traders like me, Forex (short for foreign exchange) is the single biggest & the most liquid financial market in the World.

Trillions of dollars get exchanged every single on this market. Let’s shed some light on the topic for people who don’t know much about it — the following infographic summarizes the concept beautifully. For others who are interested in trading and/or the technical setups of the USD Major pairs, I will continue after that.

Coming back to the trading side, it was a mixed bag for different pairs last week but the Dollar Index (DXY) lost ground on four out of five days. DXY started the week @ 97.47 and ended it @ 96.85 — the basket of currencies index has now made several unsuccessful attempts at the high created last November. For now, the daily gains remain capped below the 97.70 level. Let’s look at some of the hourly charts of the Major pairs to make sense of the individual moves.

EURUSD (ST Bullish, MT Neutral)

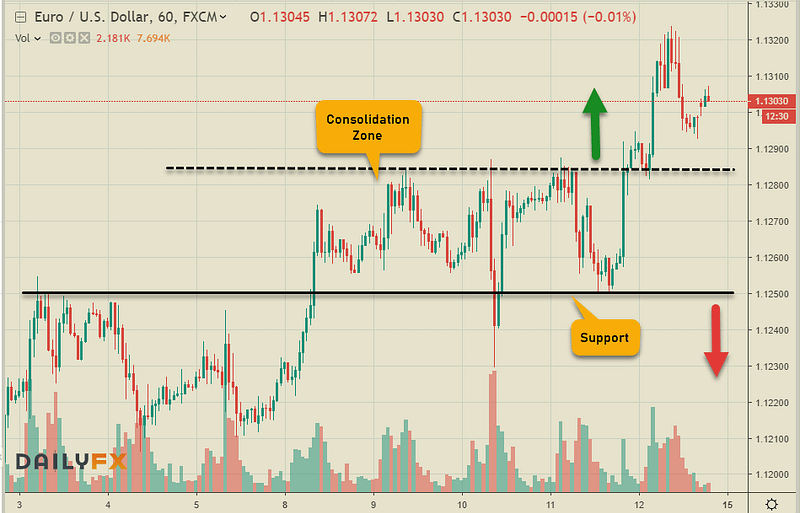
Although the most traded pair stays firmly pegged in the bearish territory, the short-term move with the daily support holding at the second attempt market by a higher low in RSI despite testing the support points towards exhaustion in the current medium-term bear run.

For the short-term, the immediate support stands @ 1.1285 which provides momentum for the bull run but a break of this level would extend the consolidation. A break of 1.1250 would flip the ST bias to the bearish side. Risk events this week include Euro-Zone ZEW Survey (Economic Sentiment), Consumer Price Index & Markit Composite PMIs.

GBPUSD (ST Neutral, MT Bearish)

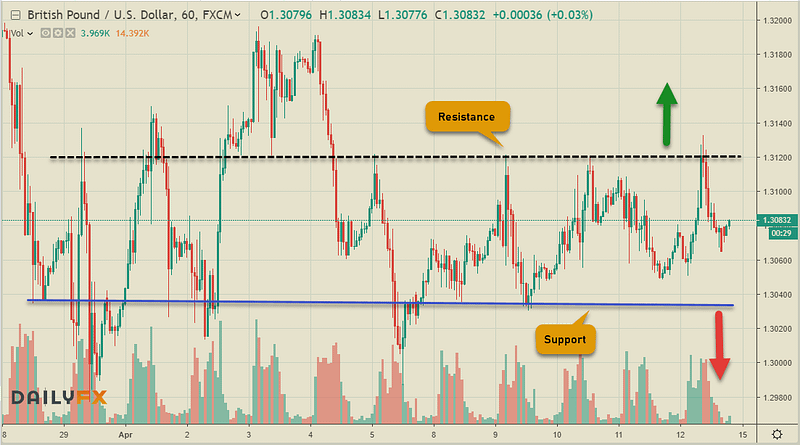
This pair has been held hostage to the uncertainty emanating from the Brexit confusion for the past many months and it is set to continue as European lawmakers have granted a longer extension for the UK to sort out the exit modalities.

The whipsawed action between 1.3040–1.3120 range continued last week with the indecisiveness in the pair. For now, the bias remains pegged in the neutral zone as long as these two levels hold on to the anchor. Data on the docket include UK quarterly employment data, CPI & Retail sales.

USDCAD (ST Bearish, MT Bullish)

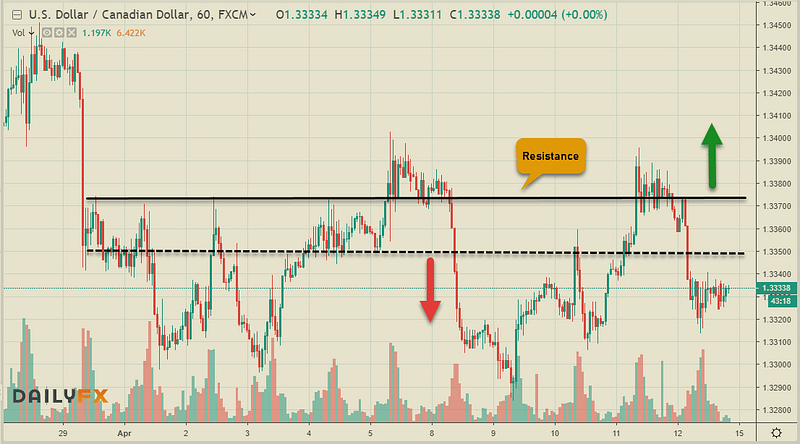
The commodity pair is having a hard time breaking the 1.3300 level in the daily chart to confirm the bearish posture in Medium-term. The break higher in Oil prices has sustained bearishness in the short-term for USDCAD but only barely. A sustained move above the 1.3400 level would confirm the continuation of the MT bullish pattern. The pair is indecisive at the moment with the next move. Economic events this week include existing Home sales, CPI & Retail sales.

USDJPY (ST Bullish, MT Bullish)

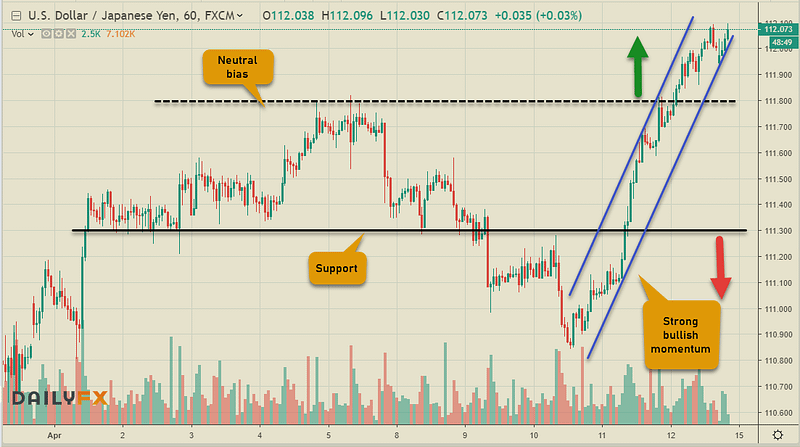
The pair has shown classic risk-on moves with the Equities bounce this week on the back of an expectation of a U.S-China trade deal soon. Sustained gains in the short-term confirm the bullish trajectory with the strong momentum set to continue above the immediate support @ 111.80 a break of which would signal an extended consolidation but as long as the strong support @ 111.30 holds, expect the bullishness to return. This week would mark the release of Japanese Industrial Production & CPI data.

AUDUSD (ST Bullish, MT Neutral)

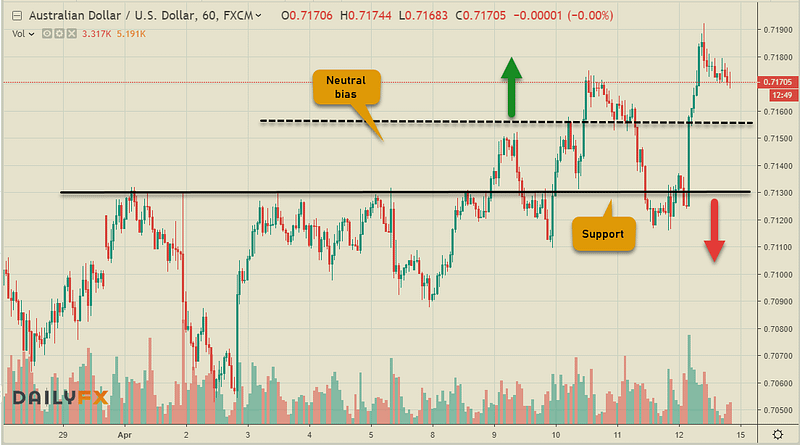
The second commodity pair has been making higher lows in the Short term with strong support at the psychological level of 0.7000 in the daily chart (MT). The immediate bias remains bullish as long as the ST support @ 0.7130 holds. This week would see RBA Minutes of April Policy Meeting, Westpac Leading Index & Employment data affecting the pair’s moves.

NZDUSD (ST Bearish, MT Bearish)

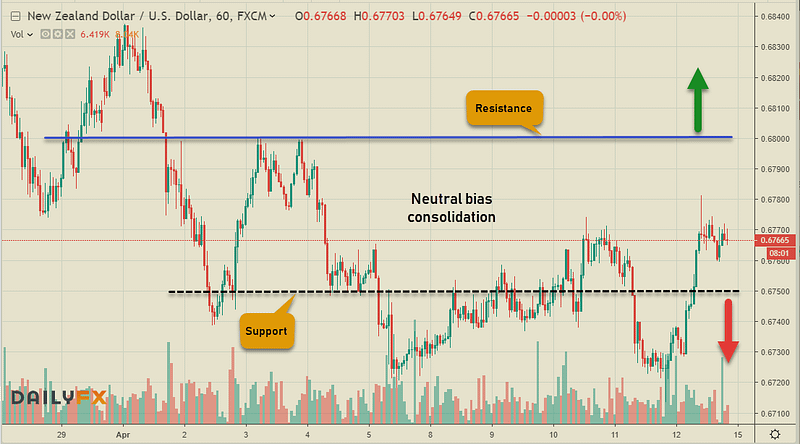
This commodity pair has been the most sluggish against the Greenback becoming the weakest performing in Majors recently as is signified by the bearish sentiment in both the Short & Medium-term. Although it survived with the bounce from the recent low of 0.6720, any gains look capped below 0.6800 — a level that needs to be penetrated convincingly to flip the ST bias. The pair would be looking at the CPI risk event this week.

USDCHF (ST Bullish, MT Bullish)

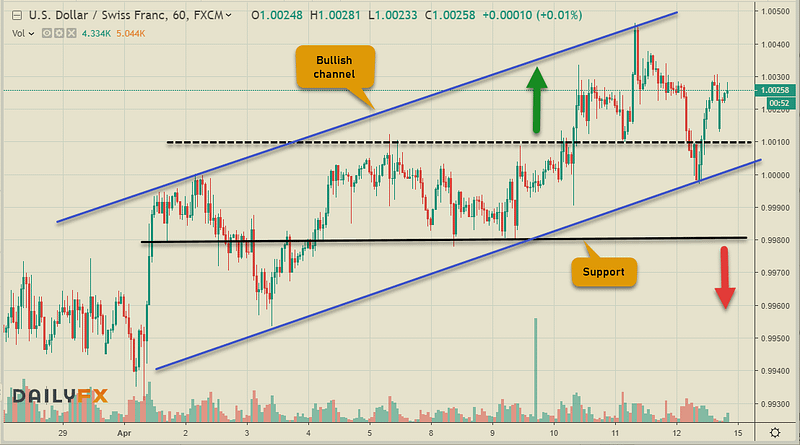
And finally, USDCHF looks comfortably placed in a bullish channel in both the hourly & daily charts with the risk-on sentiment in the global equities replicating the move of USDJPY with higher lows. Although a correction towards the immediate support @ 1.0010 looks plausible, the bullish bias is set to continue even if the pair extends the consolidation towards the next stronger support @ 0.9980. Swiss trade data released this week.

Time to wrap things up here. If you are interested in receiving FX mobile alerts daily from me, please visit Tradealike for more information or download the app & follow me. Happy Trading!

Email 📭| Twitter 📜 | LinkedIn 📑| StockTwits 📉 | Telegram 🔗

Recent Articles:

Originally published at www.datadriveninvestor.com on April 15, 2019.

Finance
Economics
Investing
Forex
Business
Recommended from ReadMedium