
A Beginner’s JavaScript Tutorial: Visualizing Your Travels with OpenStreetMap
Embark on an exciting journey into the world of JavaScript by building a simple and visually appealing project — “Where I’ve Been.”
This tutorial will guide you through the process of combining a Leaflet map with GeoJSON data to highlight all the countries you have visited.

Presentation of the Project
“Where I’ve Been” is a project that allows you to visually highlight and display the countries you’ve visited on a map, using Leaflet for mapping and GeoJSON data for country borders.
It’s an excellent way to delve into JavaScript while working on a fun and personal project that brings your travel history to life.
I’d also like to say that it’s crucial to attempt to comprehend each segment of the code.
While it might seem challenging initially, understanding the functionality behind each line is instrumental in grasping JavaScript’s essence.
Your learning will be significantly enriched through this exploration.
This project is a unique project that seamlessly blends technology with your personal experiences. It’s an engaging way to familiarize yourself with JavaScript, offering a tangible and visual result of your coding efforts.
Furthermore, showcasing this project on your GitHub can be a great addition to your portfolio.
It demonstrates your skills in working with maps, handling JSON data with fetch, and integrating various technologies, making it a valuable project for both learning and demonstrating your abilities.
Prerequisites
Before starting this project, you should have a basic understanding of HTML and JavaScript.
Familiarity with JSON will be helpful but not necessary.
Project Initialization
Initialize a new npm project:
npm init -y
Then, install Leaflet:
npm install leaflet
Create two files in your project directory: index.html and app.js.
<!DOCTYPE html>
<html lang="en">
<head>
    <meta charset="UTF-8">
    <meta name="viewport" content="width=device-width, initial-scale=1.0">
    <title>Visited Countries Map</title>
    <link rel="stylesheet" href="https://unpkg.com/[email protected]/dist/leaflet.css" />
    <style>
        #map {
            height: 100vh;
            width: 100%;
            position: absolute;
            left: 0;
            top: 0;
        }
    </style>
</head>
<body>
    <div id="map"></div>
    <script src="https://unpkg.com/[email protected]/dist/leaflet.js"></script>
    <script src="app.js"></script>
</body>
</html>
This HTML code sets up the basic structure for the project. Here’s a quick explanation of each part:
Inside the <head> tag:
<link rel="stylesheet" href="https://unpkg.com/[email protected]/dist/leaflet.css" />: This link tag includes the Leaflet CSS file from a CDN (Content Delivery Network), which provides the basic styles for the Leaflet map.
Inside the <style> tag:
- The CSS rules target the
#mapelement, setting it to take the full height and width of the viewport (100vhmeans 100% of the viewport height), positioning it absolutely at the top left corner of the page. This ensures that the map covers the entire visible area of the webpage.
Inside the <body> tag:
<div id="map"></div>: Thisdivtag with an id ofmapis where the Leaflet map will be rendered.- The two
<script>tags at the bottom of thebodytag include the Leaflet JavaScript library (which provides the mapping functionality) and theapp.jsfile (where your custom JavaScript code is located).
In essence, this HTML file is setting up a full-screen map by linking to the necessary Leaflet files, creating a container for the map, and linking to a custom JavaScript file (app.js) for additional functionality.
Adding Leaflets and Presenting Openstreetmap
In app.js, initialize the map using L.map and set the view to a global view.
const map = L.map('map').setView([20, 0], 3);[20, 0]: These are the latitude and longitude coordinates for the initial center point of the map. 20 is the latitude and 0 is the longitude. It will center the map roughly around Northern Africa.
3: This is the initial zoom level of the map. The zoom level controls how far in or out the map is zoomed, with higher numbers being zoomed in further. A zoom level of 3 is a moderately zoomed out view, showing a large portion of the world map.
Then, add the OpenStreetMap tile layer to your map with L.tileLayer and add it to your map with .addTo(map).
L.tileLayer('https://{s}.tile.openstreetmap.org/{z}/{x}/{y}.png', {
attribution: '© <a href="https://www.openstreetmap.org/copyright">OpenStreetMap</a> contributors'
}).addTo(map);This step lays the foundation for your map and connects it to the open-source map from OpenStreetMap.
Adding geo.json for Borders
For setting up the country borders on your map, you will need a geo.json file. Follow these steps to generate and add a geo.json file to your project:
- Visit https://geojson-maps.ash.ms/.
- On this website, you can generate a geo.json file containing the border data for all countries. Select the countries or areas you want to include and download the generated geo.json file.
- Place the downloaded geo.json file in the root directory of your project and rename it to
custom.geo.json.
In app.js, fetch this custom.geo.json file, which contains the border data for the countries:
fetch('custom.geo.json')
    .then((response) => response.json())
    .then((data) => {...});
This file will be used to display the borders of the selected countries on the map. The countries’ borders will be visible, giving a clear distinction between each country on the map
If you’re not comfortable with fetch, please read this article:
Building the Logic for Highlighting Visited Countries
The logic for highlighting visited countries involves checking if the country name from the GeoJSON data is included in the visitedCountries array.
If it is, style the country with a different color and opacity.
L.geoJSON(data, {
style: (feature) => {
if (visitedCountries.includes(feature.properties.name)) {
return { color: '#03DAC6', fillColor: '#03DAC6', fillOpacity: 0.3 };
}
return { color: '#E0E0E0', fillColor: '#fff', fillOpacity: 0.1 };
}
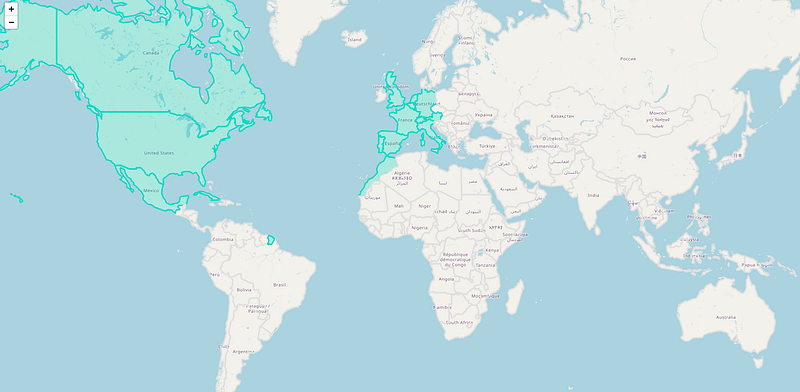
}).addTo(map);This will visually distinguish the visited countries from the others on the map.
At the end, your app.js should look like this:
const map = L.map('map').setView([20, 0], 3);
L.tileLayer('https://{s}.tile.openstreetmap.org/{z}/{x}/{y}.png', {
attribution: '© <a href="https://www.openstreetmap.org/copyright">OpenStreetMap</a> contributors'
}).addTo(map);
fetch('custom.geo.json')
.then((response) => response.json())
.then((data) => {
L.geoJSON(data, {
style: (feature) => {
if (visitedCountries.includes(feature.properties.name)) {
return { color: '#03DAC6', fillColor: '#03DAC6', fillOpacity: 0.3 };
}
return { color: '#E0E0E0', fillColor: '#fff', fillOpacity: 0.1 };
}
}).addTo(map);
});
const visitedCountries = [
'Spain',
'Portugal',
'Italy',
'Morocco',
'United Kingdom',
'Austria',
'Germany',
'Belgium',
'Netherlands',
'United States of America',
'Canada',
'Mexico',
// etc
];Conclusion
And there you have it — a personalized map of visited countries built with basic HTML and JavaScript, and spiced up with Leaflet and GeoJSON data.
This project is a testament to the power and simplicity of JavaScript, and a fantastic starting point for JavaScript beginners to work on a highly visual and original project.
You can further enhance this by adding interactivity like pop-ups with your travel photos or notes for each country.
Take this as a starting point, and let your creativity flourish in your future JavaScript endeavors!
Enjoyed the read? For more on Web Development, JavaScript, Next.js, Cybersecurity, and Blockchain, check out my other articles here:
If you have questions or feedback, don’t hesitate to reach out at [email protected] or in the comments section.
[Disclosure: Every article I pen is a fusion of my ideas and the supportive capabilities of artificial intelligence. While AI assists in refining and elaborating, the core thoughts and concepts stem from my perspective and knowledge. To know more about my creative process, read this article.]
In Plain English
Thank you for being a part of our community! Before you go:
- Be sure to clap and follow the writer! 👏
- You can find even more content at PlainEnglish.io 🚀
- Sign up for our free weekly newsletter. 🗞️
- Follow us on Twitter(X), LinkedIn, YouTube, and Discord.