
A Beginner’s Guide to Genomic Data Analysis: Quality Control and Data Preprocessing of Raw Reads using FastQC and Trimmomatic
Not always our genomic data is perfect, rather mostly it is far from perfect. We usually make changes in our data to modify it and give it a shape. This article starts at the end of the following article where we collected data for genomic analysis and requires the same prerequisites.
In the last article, we downloaded some data for sequence reads in FASTQ format, if you want to know how to get those Fastq files, refer to the above article. So first, we will learn about the FASTQ format.
Fastq Format
Fastq format is very similar to Fasta but with some extra Quality Scores added for each read in the file. There are many sources for you to learn about Fastq files, you can start by having a look at this page by Illumina where they explain the format of Fastq files or you can also view the Wikipedia page on Fastq files.
We will learn practically since we downloaded the sample files earlier in the previous article. So now, just look at the first 12 lines of our fastq file by typing the following head command:
head -12 SRR27482193_1.fastqThe output will be:
@SRR27482193.1 D64TDFP1:434:CCABEACXX:8:1101:2116:2118 length=51
CTTTTTTTTTCAACTGCTCTTTCTTTCGCTCTCTCTCTTTAATAAGATTTC
+SRR27482193.1 D64TDFP1:434:CCABEACXX:8:1101:2116:2118 length=51
CCCFFFFFHHHHHJJJJJJJJJJJJJJJJJJJJJJJJJJJIJJJJJIJJJI
@SRR27482193.2 D64TDFP1:434:CCABEACXX:8:1101:2623:2223 length=51
TACAAAAACTCAATTTTTCCTAAACTACAGTAACCCTACCGTATGCCTACA
+SRR27482193.2 D64TDFP1:434:CCABEACXX:8:1101:2623:2223 length=51
CCCFFFFFHHHHHJJJJJJJJJJJJJJJJJIJJJIJJJJJJIJJJJJJJJJ
@SRR27482193.3 D64TDFP1:434:CCABEACXX:8:1101:2776:2203 length=51
TGTAACATGGCAATACCTTTGCTCGTTTCAGTGCTACTGCTACTATTGACC
+SRR27482193.3 D64TDFP1:434:CCABEACXX:8:1101:2776:2203 length=51
CCBFFFFFHHHHHJJJJJJJJJJJJHIJJJJIIJJJJJJJJJJJJJJJJJJ
If you note, the above 12 lines are a repetition of a similar structure consisting of 4 lines. These 4 lines are like:
- The first line, starting with “@”, contains IDs of the reads, some metadata related to how this read is sequenced and at the end the length of the read.
- The second line contains actual DNA code as sequences by the sequencer.
- The third line, which contains some placeholder like “+” can also have any optional thing, like the IDs of the above read as in the first line.
- The fourth and last line contains the quality of each base as detected by the sequencer.
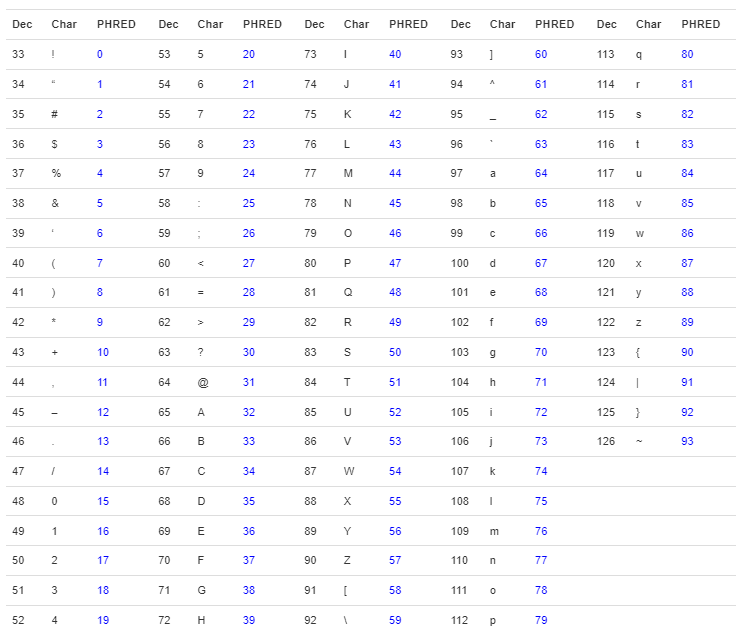
The base qualities are represented by ASCI characters, shown below, starting mostly from the character with ASCI code 33, which is “!”, but other formats are also used. The ones on the left show the lower qualities and the ones on the right show the higher qualities. The qualities are represented as the Phred scores, usually phred33 or phred4 sometimes, which you can learn more about at this link. The ASCII characters are shown below:
!"#$%&'()*+,-./0123456789:;<=>?@ABCDEFGHIJKLMNOPQRSTUVWXYZ[\]^_`abcdefghijklmnopqrstuvwxyz{|}~Hint: Quality Scores, Phred33 and ASCI Charaters
If you know about the massive parallel sequencing technology or second-generation sequencing, you will know that for each base that is sequenced, a light signal is generated and detected by the sequencing machine. There is an uncertainty for each base that is detected or sequenced when the light signal is captured. We consider the value of p as the probability that this base is sequenced incorrectly or this position is incorrect in our sequenced DNA. For example, if the value of p is 0.4 out of 1, it means there is a 40% chance that this base is sequenced incorrectly. Now, the above quality scores are nothing more than this p-value. It is the negative of the log of p taken to the base of 10 times 10 or mathematically:
Q = -10 log10 p *where p is the chance that it is an incorrect base
Keep in mind, this p value is coming from the sequencing machine. You can learn more about this from the official sources of sequencing machines. Now, as p-values in a number, so is the quality. The most common and frequently used way of converting this number to a character is using the phred33 method. It takes the value of Q, round it and adds 33 to it. Now, since it is also a number but now we have a character code for which we can look into the ASCII table and choose the corresponding letter/character. This character is represented in the fastq file as the quality score of each base.
Example:
let's say a Base G is sequenced with probabilty of incorrect base is 0.4
(the value of p is hypothetical)

p = 0.4
since Q = -10 log10(p)

so Q = 3.97 almost 4.0

Now converting to phred33, we wil add 33 to 4
phred33 = 4.0 + 33 = 37

The ASCII charater for 37 is %
So, the quality of base G will be represented by %
You can learn more about the conversions here. Further, you can view the conversion table here.
A table showing the decimal value and its corresponding Phred and characters is shown below.
FastQC
Back to our working directory, we will be using FastQC, a tool used to access the quality of sequenced reads by analyzing various metrics such as per-base sequence quality, GC content, adapter contamination, etc. This is a widely used tool and gives us a necessary combination of metrics analysis based on our file, however, it gives us a little freedom on how to calculate these metrics.
The detailed explanation of the method and individual detail on each of these metrics is out of the scope of this tutorial, rather we will focus on a hands-on approach to learn how we use this tool as it is. The detail on each of these metrics is well explained on the FastQC website along with sample reports. However, the key to thriving in genomic data science is developing strong basics. For any kind of issues you face, for example, if the Fastqc report is not up to the mark, it is always a good idea to ask your peers or to get help from the community using platforms like Biostar or Stack Overflow.
Without talking much, let’s learn by doing it.
Checking Quality of our reads using “FastQC”
Head to the official website of FastQC, get familiar with what the tool does and look at some sample reports provided. You will need to go to the download page by clicking on the download button shown on the home page of the FastQC website. FastQC is a Java-based tool, so we need to make sure that Java is installed in our system before running FastQC. If you run into any error, check out the installation instructions given on their website.
To download and install the tool using the command line, execute the following lines one by one.
Now that we have FastQC installed, it can be used both using a graphical user interface and a command line interface. First, we will try the Command Line Interface (CLI), which is very simple to execute. Feel free to get help by simply typing fastqc — help in the terminal. Afterwards, proceed as follows:
After this script ends running, you will get HTML files for each of the FASTQ files, which in the case of Windows Subsystem Linux (Wsl), you can copy to your local machine (The Windows directors like C:// and D:// are located in the WSL /mnt directory) or open file explorer there by typing “explorer.exe .” in the terminal (which will open file explorer in the current WSLpath). Now, open the files in your browser. If you look at the sidebar on the left, you will get a general idea about the report marked by green colour for good quality, red colour for failed to meet quality and orange colour for a warning.
Here are our results.
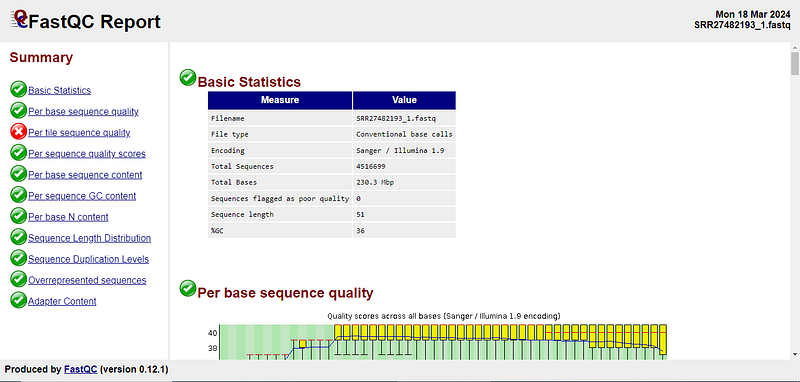
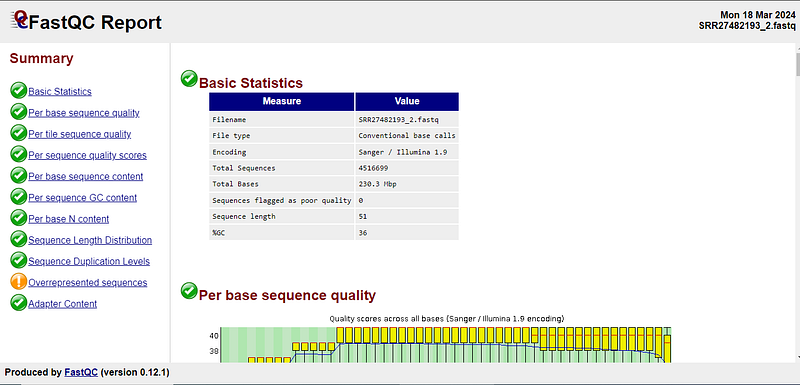
A brief about analyzing the report: Things to care about in the report
Luckily, most of the tests on our reads have passed. You can learn more about the qualities of Fastq files from this video at the specified time. There are certain things you must care about to continue the analysis, which are discussed below.
Typically, the per-base sequence qualities below 20 quality scores are really bad, (which is also evident from the per-base sequence quality chart in our Fastqc report, if you focus on the red colour) and you may want to trim those reads. Removing such reads is important because if we don't, we may get false results based on the sequenced reads which are not correct themselves due to low-quality scores.
Furthermore, sometimes there can be repeats occurring more frequently in the reads. Such repeats may come from Adapter sequences attached to the DNA fragments for sequencing, if these adapters are not removed, we will still get bad-quality reads, repeating the sequences which are not part of DNA. However, sometimes the repeats may be valid and found within the DNA.
Another important thing in checking qualities is removing the unknown or null bases, for which the sequencer is confused about which base it was. Such bases are represented by N, rather than any of A, C, G or T.
There are various other factors, which you can read more about from the actual docs of FastQC and look for sample reports at the following site.
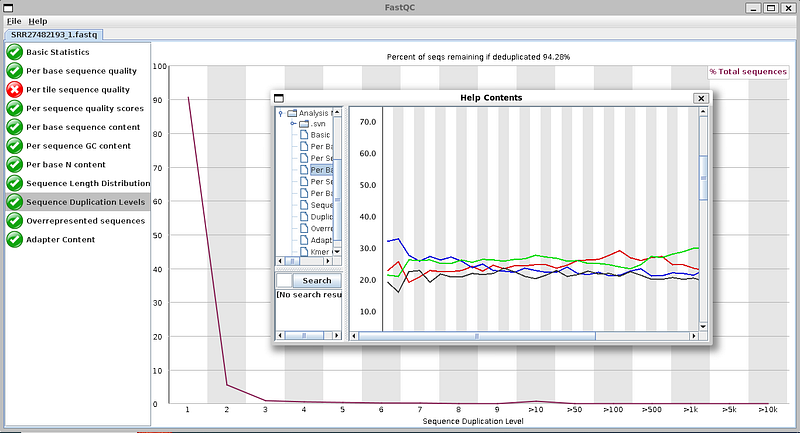
FastQC GUI
If you don’t find it easy to move and view HTML files, you can type fastqc in the terminal and continue with the graphical user interface of FastQC, where you can check the quality of reads one by one. Usage is simple, go to file in the upper left corner, click on it and choose open to select your Fastq files, then run and wait for the result shown in the GUI app.
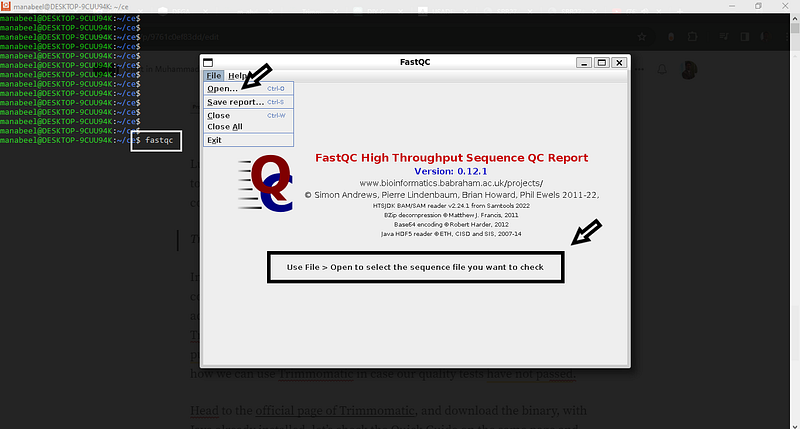
FastQC GUI also provides some essential documentation within the GUI app.
Trimming bad reads using “Trimmomatic”
In cases where the quality of reads is not so fine and our reads contain contamination from various sources. For example, our reads may contain adapter sequences which are still to be removed, in other cases, there may be sequences with low-quality bases or the sequencer is unable to understand and interpret the signals and results in N instead of any of A, C, G or T. In such cases we perform, trimming of reads, Trimmomatic is such a tool to perform trimming over reads. As the purpose of this series is to get familiar with the command line, we will still see how we can use Trimmomatic with default options in case our quality tests have not passed.
Head to the official page of Trimmomatic, and download the binary, with Java already installed, check the Quick Guide on the same page and check the easy-to-follow instructions.
Trimmomatic comes as a ready-to-use file, if you have Java installed, you can just download the file and extract it. Then you can run the program.
wget http://www.usadellab.org/cms/uploads/supplementary/Trimmomatic/Trimmomatic-0.39.zip
unzip Trimmomatic-0.39.zip
mv Trimmomatic-0.39 /usr/local/bin/
After unzipping, if you type the base command for getting help, which is:
java -jar /usr/local/bin/Trimmomatic-0.39/trimmomatic-0.39.jar --helpYou will get an output like this:
# java -jar /usr/local/bin/Trimmomatic-0.39/trimmomatic-0.39.jar --help
Usage:
       PE [-version] [-threads <threads>]
          [-phred33|-phred64] [-trimlog <trimLogFile>]
          [-summary <statsSummaryFile>] [-quiet] [-validatePairs]
          [-basein <inputBase> | <inputFile1> <inputFile2>]
          [-baseout <outputBase> | <outputFile1P> <outputFile1U>
          <outputFile2P> <outputFile2U>] <trimmer1>...
   or:
       SE [-version] [-threads <threads>]
          [-phred33|-phred64] [-trimlog <trimLogFile>]
          [-summary <statsSummaryFile>]
          [-quiet] <inputFile> <outputFile> <trimmer1>...
   or:
       -version
You can guess by reading this that trimmomatic can take input either as PE, which means Paired-End reads or it can run with Single-End reads, specifying options for each of the use cases. Since we have paired-end reads, we will be using the PE command. We can specify some options like using multiple threads for better speedy performance, mentioning whether its phred33 (33 added to quality = -10log10 p)or phred64 (64 added to quality = -10log10 p). Similarly, we can choose options for logs as well as summaries. However, the importance files to add are the output filenames, which act like compulsory to run trimmomatic. At the end, we have to mention things like which adapters to trim etc.
If you see within the directory Trimmomatic-0.39/, you will find a sub-directory named adapters, which contains some adapter sequences, already given in the installation. The details of how and why they are using and their license are given on the Trimmomatic website.
ls /usr/local/bin/Trimmomatic-0.39/

# output
LICENSE  adapters  trimmomatic-0.39.jar

ls /usr/local/bin/Trimmomatic-0.39/adapters/
# output
NexteraPE-PE.fa  TruSeq2-PE.fa  TruSeq2-SE.fa  TruSeq3-PE-2.fa
TruSeq3-PE.fa  TruSeq3-SE.fa
We can now study our reads, choose the appropriate adapter file and give it to Trimmomatic after ILLUMINACLIP and further specify options like 2:30:10 in the form of seedMismatches: palindromeClipThreshold: simpleClipThreshold. We can also mention removing low-quality bases from the leading and trailing end by specifying the minimum quality to keep at the start or end. In the end, we can mention the sliding window, like what should be the size of the window and what average quality of all bases inside a window to keep. For example, Sliding window value 4:15 means, creating sliding windows of size 4 and for each of 4 bases inside the sliding window, keep them if the average of their qualities is 15 or more. Lastly, we can specify minLength about the minimum size of read to keep after trimming.
We will be sticking to the default options given by Trimmomatic documentation, which are:
java -jar Trimmomatic-0.39/trimmomatic-0.39.jar PE -threads 4 \
reads/SRR27482193/SRR27482193_1.fastq reads/SRR27482193/SRR27482193_2.fastq \
trim/SRR27482193_1P_trimmed.fastq trim/SRR27482193_1U_trimmed.fastq \
trim/SRR27482193_2P_trimmed.fastq trim/SRR27482193_2U_trimmed.fastq \
ILLUMINACLIP:Trimmomatic-0.39/adapters/TruSeq3-PE.fa:2:30:10 \
LEADING:3 TRAILING:3 SLIDINGWINDOW:4:15 MINLEN:36
The sum of all the operations you may want to perform using Trimmomatic is given below as a script:
This operation will create new files which are filtered of bad reads, you should check its quality again using FastQC. The process of pre-processing may take multiple iterations practically, depending upon the results of FastQC and trimming by Trimmomatic. Practically, we will be running FastQC again on these files and see if the quality improved. If improved and ready to use, we will continue with analysis, otherwise, we will identify the gaps and rule out what needs to be done. Getting support from community platforms like Biostar or Stack Overflow can be of utmost importance if you are stuck or new in the field.
So, you can view the HTML files again and again, and keep trimming and pre-processing until you reach the required quality of reads.
Further details can be found in the Quick Start and Description section of the official Trimmomatic webpage.
Also on the official GitHub:
That’s all about the command line use of these two basic tools used in the quality control of sequencing data. There are plenty of other tools available providing their functionalities, examples are Fastp and Cutadapt, feel free to explore each of these as well as try them on a variety of sequenced data (which you can obtain from https://www.ncbi.nlm.nih.gov/sra). The important thing is that these are all the tools to perform operations, the tools can be redesigned, developed or changed and familiarity with the computational aspect and practice can help us use any new tools in the field. However, the theoretical knowledge of the field and core concepts are of utmost essential for successful data pre-processing and genomic analysis.
Next | Genome Mapping with Bowtie2
In the upcoming article, we will be mapping our reads to a reference genome and visualizing the mapped genome to see if we can find anything useful by visually looking at it.
Twitter: vet_abdullah_n


