
Power Up Your Power BI: Dynamic Color Coding for Bar Charts
Harness Threshold Values to Visually Amplify Your Data Insights
Introduction
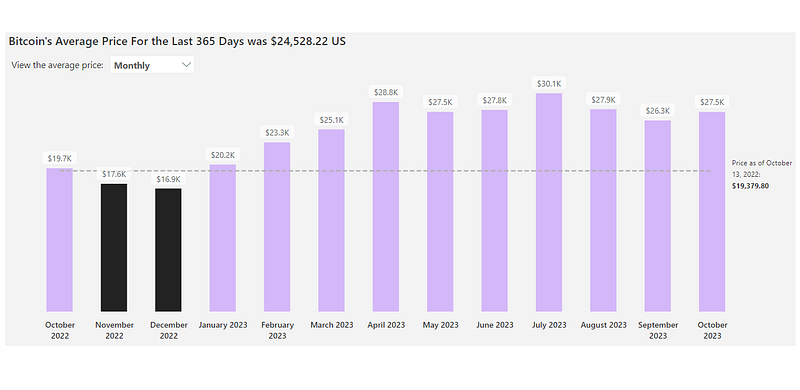
Visual representations, like bar charts, are pivotal for data interpretation. One method of enhancing such visuals is by changing bar colors based on predefined thresholds. Power BI provides an effective way to achieve this through its DAX language and color functionalities. In this guide, we’ll dynamically assign colors to a bar chart tracking Bitcoin’s average price, in comparison to its price the previous year.
Data Context
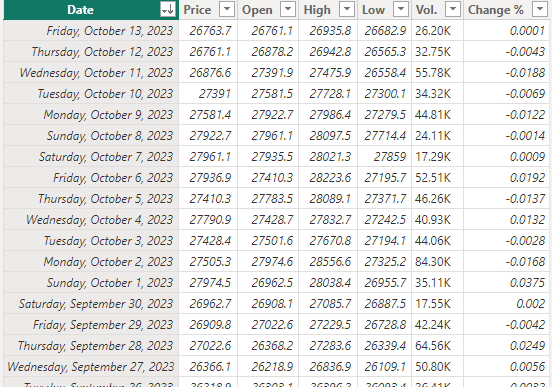
To give a clearer picture, let’s consider a dataset that documents Bitcoin’s average price across different time frames (daily, weekly, monthly) and compare these figures against a benchmark price from the previous year, specifically at $19,380 US. This data was sourced from Investing.com on October 13, 2023. After uploading, the dataset is referred to as “Bitcoin Historical Data”.
Steps to Achieve Dynamic Coloring in Power BI:
1. Prepare a Calendar Table:
Working with dates often requires a calendar table. Here’s a simple method to create one in Power Query. While this guide won’t delve into all the nuances of creating the calendar, the provided code is a helpful starting point:
let
    GetMinDate = Date.StartOfMonth(List.Min(#"Bitcoin Historical Data"[Date])),
    GetMaxDate = Date.EndOfMonth(List.Max(#"Bitcoin Historical Data"[Date])),
    Source = #table({"MinDate", "MaxDate"}, {{GetMinDate, GetMaxDate}}),
    AddDateColumn = Table.AddColumn(Source, "Date", each {Number.From([MinDate])..Number.From([MaxDate])}),
    ExpandDates = Table.ExpandListColumn(AddDateColumn, "Date"),
    SelectColumns = Table.SelectColumns(ExpandDates, {"Date"}),
    ChangeType = Table.TransformColumnTypes(SelectColumns,{{"Date", type date}}),
    AddYearColumn = Table.AddColumn(ChangeType, "Year", each Date.Year([Date])),
    AddMonthColumn = Table.AddColumn(AddYearColumn, "Month", each Date.MonthName([Date])),
    AddMonthNumColumn = Table.AddColumn(AddMonthColumn,"Month No.", each Number.ToText([Year]) &" - " &  Text.End("0" & Number.ToText(Date.Month([Date])),2)),
    AddWeekNumColumn = Table.AddColumn(AddMonthNumColumn,"Week No.", each Number.ToText([Year]) &" - " &  Text.End("0" & Number.ToText(Date.WeekOfYear([Date])),2)),
    AddMonthYearColumn = Table.AddColumn(AddWeekNumColumn, "Year & Month", each [Month] & " " & Number.ToText([Year])),
    ChangeDataType = Table.TransformColumnTypes(AddMonthYearColumn,{{"Year", Int64.Type}, {"Month", type text}, {"Month No.", type text}, {"Week No.", type text}, {"Year & Month", type text}})
in
    ChangeDataType
2. Prepare the Bar Chart and Comparison Values:
- Average Bitcoin Price: Calculate the average price using the following DAX formula:
Average Bitcoin Price = AVERAGE('Bitcoin Historical Data'[Price])
- Initial Price Calculation: First, find the minimum date:
Minimum date = MIN('Bitcoin Historical Data'[Date])Then, compute the price corresponding to this date. To prevent any relationship conflicts with dates, use a “No relations” table that replicates “Bitcoin Historical Data”:
No relations = 'Bitcoin Historical Data'

Initial Price =
VAR _MinimumDate =
    CALCULATE(
        [Minimum date],
        ALL(Dates)
    )
VAR _InitialPrice =
CALCULATE(
    AVERAGE('No relations'[Price]),
    FILTER(
        'No relations',
        'No relations'[Date] = _MinimumDate
    )
)
RETURN _InitialPrice
3. Choose Colors & Define Business Logic:
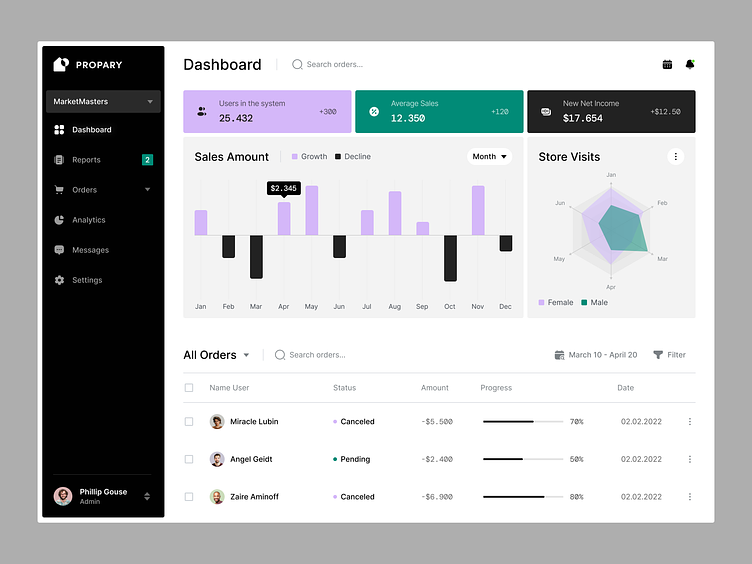
Draw inspiration from designs or existing visuals. As an example, colors were taken from a design by Halo Lab:
_const Color Over = "#D4B7F9"

_const Color Under = "#222222"
Define the color-assigning rule based on the average Bitcoin price compared to the initial price:
Color Bars =
    IF(
        [Average Bitcoin Price]<[Initial Price],
        [_const Color Under],
        [_const Color Over]
    )
4. Construct the Bar Chart:
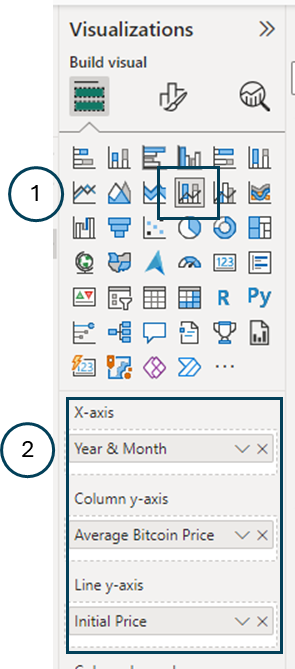
A. Chart Selection: Choose the ‘Line and Stacked Column Chart’ visual from the visuals pane.
B. Values: Drag and place appropriate values in the X-axis (‘Year & Month’), Column y-axis (‘Average Bitcoin Price’), and Line y-axis (‘Initial Price’).
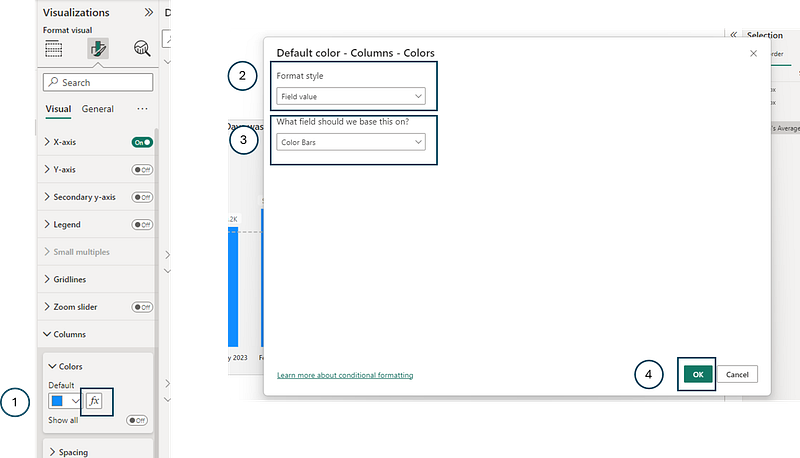
C. Conditionnal Color Formatting: Navigate to the formatting pane, under ‘Columns’, and click the fx icon. Choose ‘Field Value’ and link it to the “Color Bars” measure. Confirm your selection.
5. Apply additionnal formatting (optionnal)
To elevate the visual appeal and usability of the chart, consider applying these additional formatting touches:
A. Background Aesthetics: Modify the background color to a subtle light grey with the code #F3F3F3.
B. Streamlining Axes:
- Remove unnecessary axis titles for a cleaner look.
- Emphasize the X-axis values by bolding them.
- Remove data labels for the line.
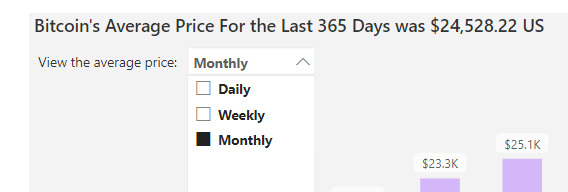
C. Dynamic Chart Title: Automate your chart title to reflect current data. The following measure accomplishes this:
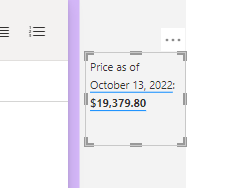
Title = "Bitcoin's Average Price For the Last 365 Days was " & FORMAT([Average Bitcoin Price], "$###,###,###.##") & " US"D. Series Title Incorporation: Augment clarity by adding a text box labeled “Price as of” and pair it with values from [Minimum Date] and [Initial Price] to inform viewers of the data’s temporal context.
E. Line Customization: Opt for a dashed line style in the chart to distinguish it from other visual elements.
F. User-Interactive Time Selection: Empower your audience by letting them choose their desired data-viewing time frame, whether that’s on a daily, weekly, or monthly basis. For those keen on implementing this user-centric feature, stay tuned for an upcoming article detailing the process in Power BI under the title “User Field to Select Time Period.”
With these enhancements, your Power BI chart not only presents data but does so in a user-friendly, aesthetically pleasing manner.
Conclusion
Power BI’s capabilities, especially with DAX, open up numerous possibilities for data representation. Dynamic color assignments, as illustrated above, provide an intuitive way to highlight crucial data points and improve overall data comprehension.
Don’t forget to subscribe to
👉 Power BI Publication
👉 Power BI Newsletter
and join our Power BI community
👉 Power BI Masterclass


