
9 Python Libraries That Turn Raw Data into Ready-to-Publish Reports
#1. How to Extract Tables from PDFs Using the Python Library Camelot
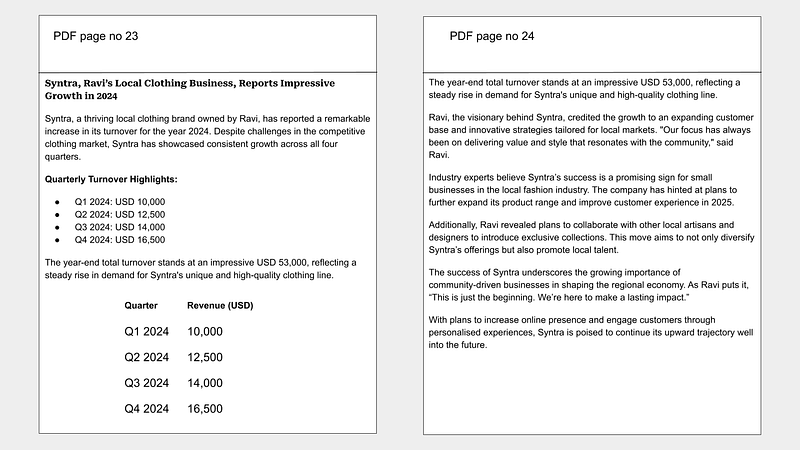
In this ready-to-publish report, first, we have Camelot. Camelot is an excellent PDF library that can extract tables from PDFs based on the folder file path you provide in your code. It automatically extracts data from the PDF and consolidates it in one place.
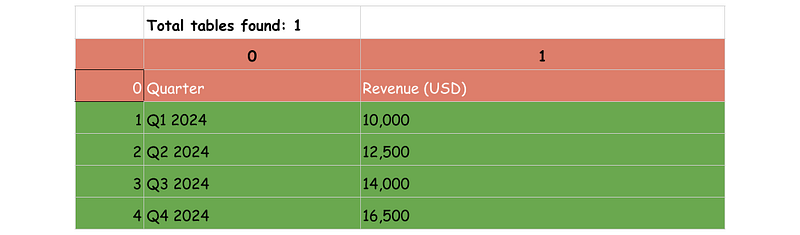
By adjusting just a few lines of code, as shown in the image, you can see how the PDF file, which I’ve taken a screenshot of, displays the extracted table based on the file path provided from my computer.
You can easily find the file location by clicking the folder search bar. Once you’ve located it, paste the path into a code editor. For example, look at the PDF file below.
/path/to/your/pdf/financial_report.pdf
import camelot

# Specify the PDF file path
file_path = ""/path/to/your/pdf/financial_report.pdf""

# Read the PDF and extract tables
tables = camelot.read_pdf(file_path, pages="1")  # Specify the page number(s)

# Print the number of tables found
print(f"Total tables found: {len(tables)}")

# Display the extracted data from the first table
print(tables[0].df)

# Export the first table to a CSV file
output_csv = "quarterly_revenue.csv"
tables[0].to_csv(output_csv)

print(f"Table saved to {output_csv}")
Now, once you click the “Run” button, it will take a few moments to generate the data, which you can easily copy and paste for your next project.
How simple is that? You can use VS Code or Jupyter Notebook, which are both simple options, or you can choose any other editor you prefer.
Console Output: Total tables found: 1
#2. Sweetviz: The Best Library for Ready-to-Publish Reports
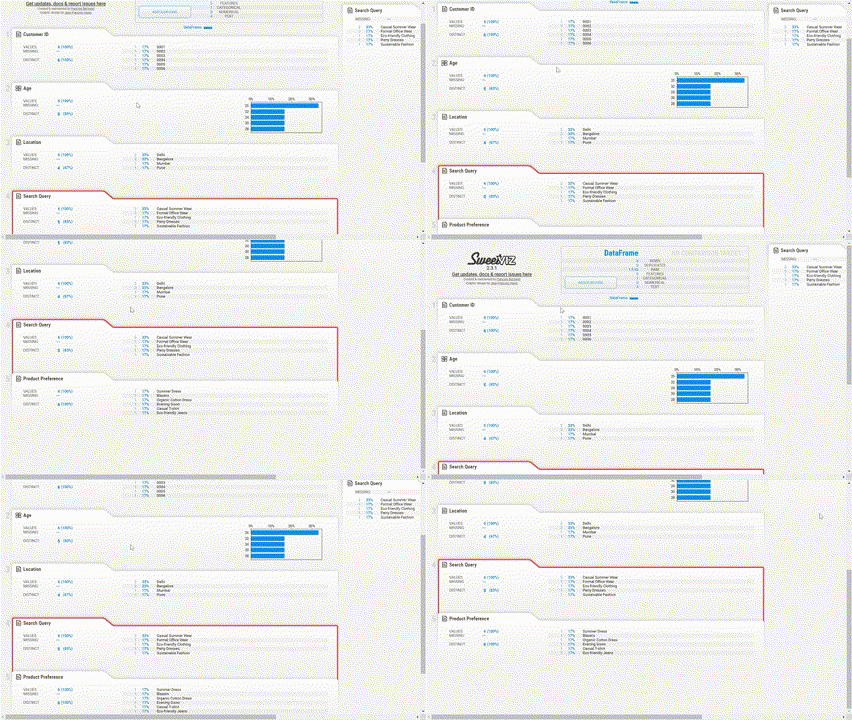
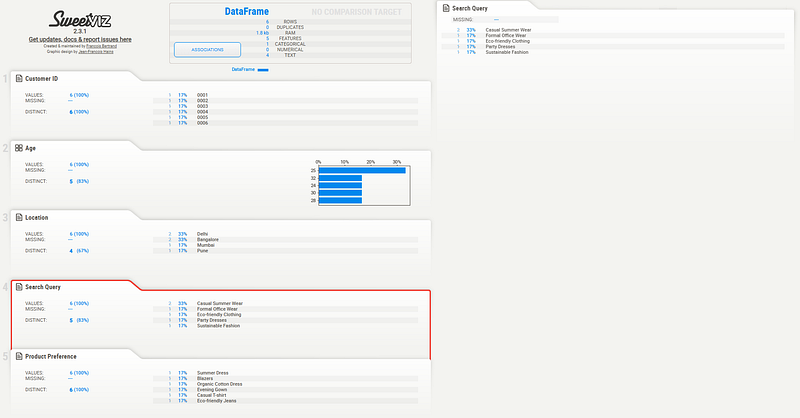
Another library you can use for a ready-to-publish report is Sweetviz. It’s a report visualization library that works with pandas for raw data processing. First, it takes files like CSS, processes them, and generates a report in a web format.
Unlike Metabase, which requires a database, or libraries like Plotly, which involve high-level interactions and coding, Sweetviz focuses on keeping things simple with minimal setup. This allows users to quickly publish their reports, but that’s why it has limited customization options.
# Install Sweetviz
!pip install sweetviz

# Import necessary libraries
import pandas as pd
import sweetviz as sv

# Your example data
data = {
    'Customer ID': ['0001', '0002', '0003', '0004', '0005', '0006'],
    'Age': [25, 32, 24, 30, 28, 25],
    'Location': ['Delhi', 'Mumbai', 'Bangalore', 'Pune', 'Delhi', 'Bangalore'],
    'Search Query': ['Casual Summer Wear', 'Formal Office Wear', 'Eco-friendly Clothing', 'Party Dresses', 'Casual Summer Wear', 'Sustainable Fashion'],
    'Product Preference': ['Summer Dress', 'Blazers', 'Organic Cotton Dress', 'Evening Gown', 'Casual T-shirt', 'Eco-friendly Jeans']
}

# Convert the dictionary to a DataFrame
df = pd.DataFrame(data)

# Create a Sweetviz report
report = sv.analyze(df)

# Show the report in the notebook and save it as an HTML file
report.show_html('sweetviz_report.html')

# Download the Sweetviz report
from google.colab import files
files.download('sweetviz_report.html')
Output: —
#3. Tabulate: Easily Convert Data into Styled Tables
Tabulate offers extensive features for tables in report outputs, enhancing the user experience. It works with borders, formatting, columns, sorting, text wrapping, and more.
Not only does it look great, but it also makes the data ready for publication with just a few lines of code. There’s no need for users to create tables manually in Excel sheets or elsewhere.
from tabulate import tabulate

# Data
data = {
    'Customer ID': ['0001', '0002', '0003', '0004', '0005', '0006'],
    'Age': [25, 32, 24, 30, 28, 25],
    'Location': ['Delhi', 'Mumbai', 'Bangalore', 'Pune', 'Delhi', 'Bangalore'],
    'Search Query': ['Casual Summer Wear', 'Formal Office Wear', 'Eco-friendly Clothing', 'Party Dresses', 'Casual Summer Wear', 'Sustainable Fashion'],
    'Product Preference': ['Summer Dress', 'Blazers', 'Organic Cotton Dress', 'Evening Gown', 'Casual T-shirt', 'Eco-friendly Jeans']
}

# Generate the table in Asciidoc Mono format
table = tabulate(data, headers="keys", tablefmt="asciidoc_mono")

# Print the table
print(table)
Output: —
Customer ID    Age  Location    Search Query           Product Preference
-------------  -----  ----------  ---------------------  --------------------
         0001     25  Delhi       Casual Summer Wear     Summer Dress
         0002     32  Mumbai      Formal Office Wear     Blazers
         0003     24  Bangalore   Eco-friendly Clothing  Organic Cotton Dress
         0004     30  Pune        Party Dresses          Evening Gown
         0005     28  Delhi       Casual Summer Wear     Casual T-shirt
         0006     25  Bangalore   Sustainable Fashion    Eco-friendly Jeans
#4. Edit PDFs Using PyPDF2
In a ready-to-publish report, if time is short and the workload is heavy, use PyPDF2. It’s a super Python library that offers editing options for your PDF data.
With PyPDF2, you can split PDFs, merge them, compress files, add watermarks, and decrypt PDFs — everything you need, all with this powerful library.
how to slpit pdf
from PyPDF2 import PdfWriter, PdfReader

reader = PdfReader("example.pdf")
writer = PdfWriter()

for page in reader.pages[0:2]:  # Extract first two pages
    writer.add_page(page)

with open("split.pdf", "wb") as output_pdf:
    writer.write(output_pdf)
How to merge pdf
from PyPDF2 import PdfMerger

merger = PdfMerger()
merger.append("file1.pdf")
merger.append("file2.pdf")
merger.write("merged.pdf")
merger.close()
#5. Yattag: Simplifying Report Creation with Clean HTML/XML Syntax
In a ready-to-publish report, Yattag plays a critical role in creating HTML syntax. Just modify your Python code according to the desired report or HTML structure.
Personally, I would use it for designing my website, and this can be done by making changes in just a few lines of code. The interesting part is that I don’t need to write any HTML syntax — I just need to modify the Python code with the Yattag library.
from yattag import Doc

doc, tag, text = Doc().tagtext()

with tag('html'):
    with tag('body'):
        with tag('h1'):
            text('Hello, Yattag!')

print(doc.getvalue())
Adding CSS/JavaScript
with tag('style'):
    text('body { font-family: Arial; }')
with tag('script'):
    text('console.log("Hello from Yattag!");')
#6. PrettyTable: For Ready-to-Publish Console Reports
PrettyTable is a tabular library that takes input in tabular form, as you can see below, and transforms it into a table. It also comes with multiple features that allow you to edit the table, all by making just a few changes in the code.
from prettytable import PrettyTable

# Example data
data = {
    'Customer ID': ['0001', '0002', '0003', '0004', '0005', '0006'],
    'Age': [25, 32, 24, 30, 28, 25],
    'Location': ['Delhi', 'Mumbai', 'Bangalore', 'Pune', 'Delhi', 'Bangalore'],
    'Search Query': ['Casual Summer Wear', 'Formal Office Wear', 'Eco-friendly Clothing', 'Party Dresses', 'Casual Summer Wear', 'Sustainable Fashion'],
    'Product Preference': ['Summer Dress', 'Blazers', 'Organic Cotton Dress', 'Evening Gown', 'Casual T-shirt', 'Eco-friendly Jeans']
}

# Create a PrettyTable object
table = PrettyTable()

# Setting field names
table.field_names = ["Customer ID", "Age", "Location", "Search Query", "Product Preference"]

# Adding rows to the table
for i in range(len(data['Customer ID'])):
    table.add_row([
        data['Customer ID'][i],
        data['Age'][i],
        data['Location'][i],
        data['Search Query'][i],
        data['Product Preference'][i]
    ])

# Print the table
print(table)
Output: —
+--------------+-----+-----------+-----------------------+------------------------+
| Customer ID  | Age | Location  |      Search Query      |   Product Preference    |
+--------------+-----+-----------+-----------------------+------------------------+
|     0001     |  25 |   Delhi   | Casual Summer Wear     |      Summer Dress       |
|     0002     |  32 |  Mumbai   | Formal Office Wear     |        Blazers          |
|     0003     |  24 | Bangalore | Eco-friendly Clothing  |  Organic Cotton Dress   |
|     0004     |  30 |   Pune    | Party Dresses          |     Evening Gown        |
|     0005     |  28 |   Delhi   | Casual Summer Wear     |     Casual T-shirt      |
|     0006     |  25 | Bangalore | Sustainable Fashion    |  Eco-friendly Jeans     |
+--------------+-----+-----------+-----------------------+------------------------+
#7. Are MPLD3 and Matplotlib a Powerful Combination for Data Visualization?
MPLD3 is like the “decoration on a well-prepared dish,” where the dish is Matplotlib and the decoration is MPLD3.
In the ready-to-publish concept, MPLD3 makes the report more interactive by adding features with just a few changes in the code.
# Install MPLD3
!pip install mpld3

# Import necessary libraries
import matplotlib.pyplot as plt
import mpld3
from mpld3 import plugins

# Your example data
data = {
    'Customer ID': ['0001', '0002', '0003', '0004', '0005', '0006'],
    'Age': [25, 32, 24, 30, 28, 25],
    'Location': ['Delhi', 'Mumbai', 'Bangalore', 'Pune', 'Delhi', 'Bangalore'],
    'Search Query': ['Casual Summer Wear', 'Formal Office Wear', 'Eco-friendly Clothing', 'Party Dresses', 'Casual Summer Wear', 'Sustainable Fashion'],
    'Product Preference': ['Summer Dress', 'Blazers', 'Organic Cotton Dress', 'Evening Gown', 'Casual T-shirt', 'Eco-friendly Jeans']
}

# Creating a scatter plot
fig, ax = plt.subplots()
scatter = ax.scatter(data['Age'], data['Location'], color='b', s=100, alpha=0.5)

# Adding tooltips with customer information
tooltip_labels = [
    f"ID: {data['Customer ID'][i]}<br>Search: {data['Search Query'][i]}<br>Product: {data['Product Preference'][i]}"
    for i in range(len(data['Customer ID']))
]
tooltip = plugins.PointLabelTooltip(scatter, labels=tooltip_labels)
plugins.connect(fig, tooltip)

# Set plot title and labels
ax.set_title('Customer Age vs. Location with Interactive Tooltips', size=16)
ax.set_xlabel('Age')
ax.set_ylabel('Location')

# Save the plot to an HTML file
html_code = mpld3.fig_to_html(fig)
with open('interactive_plot.html', 'w') as f:
    f.write(html_code)

# Download the HTML file
from google.colab import files
files.download('interactive_plot.html')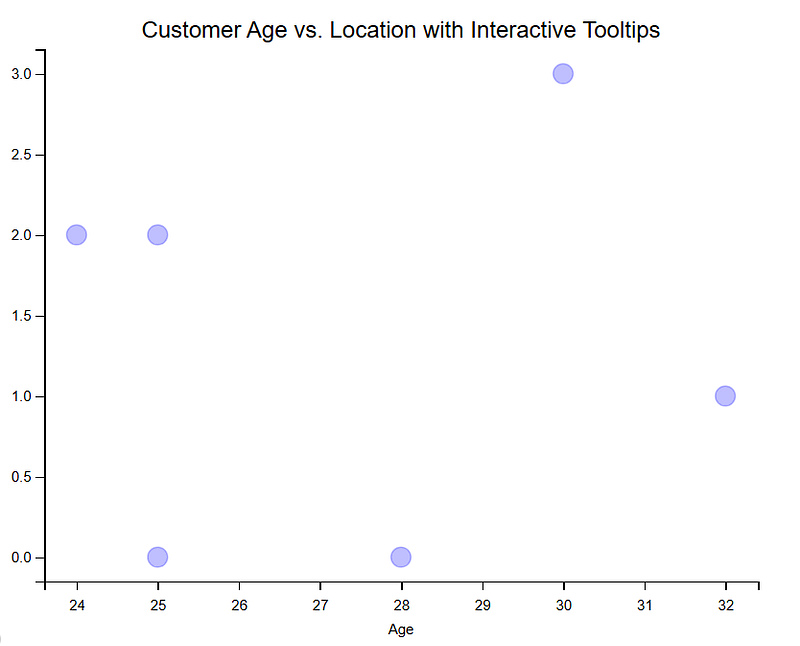
#8. Can WeasyPrint Abstract PDFs from HTML and CSS Layouts?
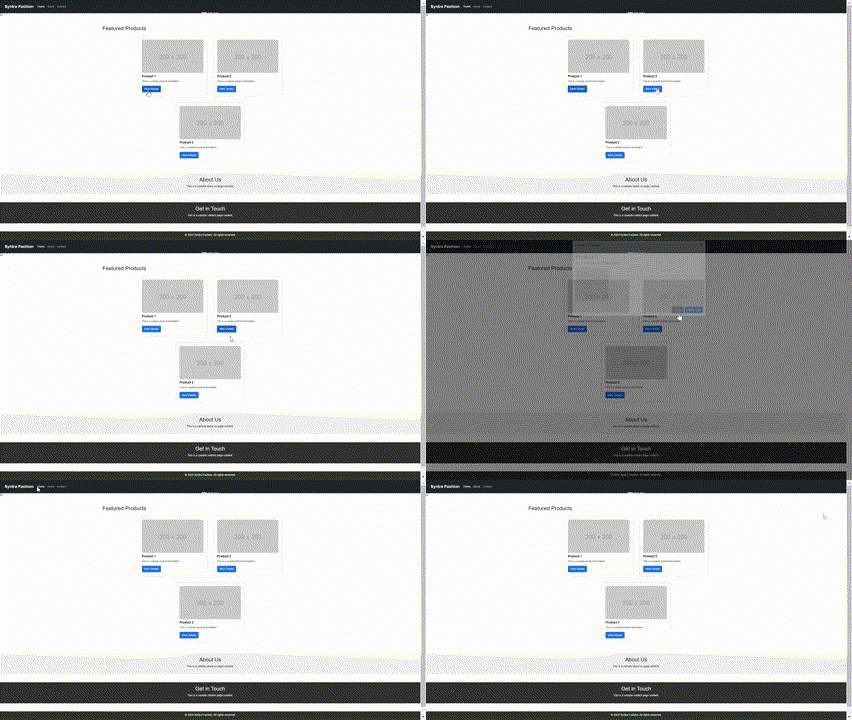
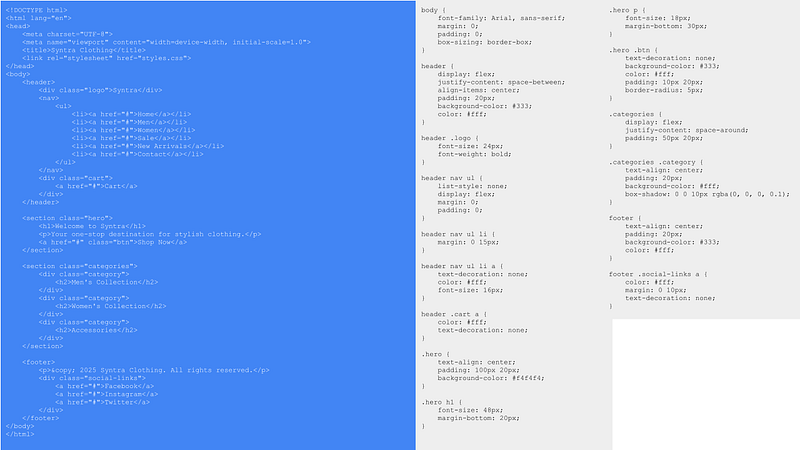
In this project, we will be using WeasyPrint. WeasyPrint is a Python library that allows us to create a PDF directly from HTML and CSS. The image below shows an abstracted HTML and CSS file from the Syntra site, which also includes a GIF from a popular clothing brand.
For the project, we will use the WeasyPrint library to transform this into a ready-to-publish PDF. One thing I personally like about WeasyPrint is that it preserves elements like the header, logo, footer, and contact details, making the PDF look exactly like the original format — almost as if you took a screenshot, but it generates a PDF instead.
Install WeasyPrint pip
pip install weasyprint
from weasyprint import HTML

# Path to your HTML file
html_file_path = 'example.html'

# Path to your output PDF file
pdf_output_path = 'output_report.pdf'

# Convert the HTML (and CSS if linked in the HTML) to a PDF
HTML(html_file_path).write_pdf(pdf_output_path)

# Print the output file path
print(f"PDF has been generated and saved to: {pdf_output_path}")
#9. Can You Generate Modern PDFs Using Just a Few Lines of PyFPDF2 Code?
Turn your code into an easy-to-publish PDF with just a few simple Python steps. Not only that, but it also allows you to customize your PDF programmatically with a simple Python library called PyFPDF2. PyFPDF2 is a popular library in the business field for ready-to-publish documents, especially known for its customization options.
First, choose your code editor — I’ve chosen Google Colab here, as I felt it’s a great fit for this project. Then, simply install the PyFPDF2 library using the command below:
from google.colab import files
uploaded = files.upload()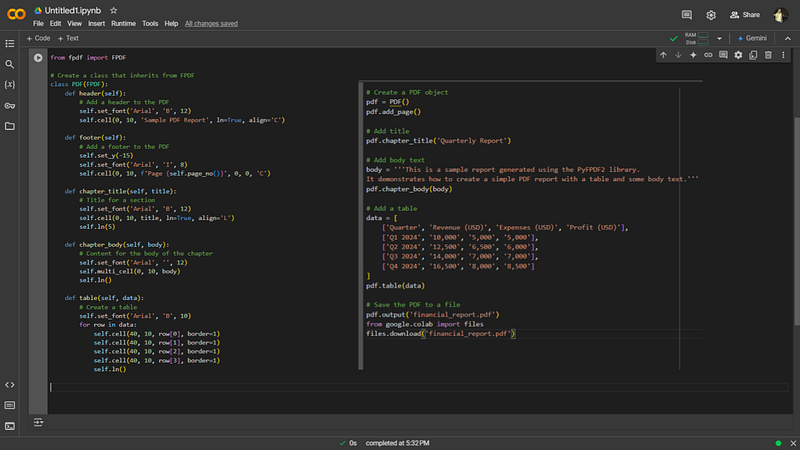
Below, I have generated a PDF based on the information I fed into the program and executed in the code editor. I simply used Google Colab as the code editor, and boom, it generated the ready-to-publish document.
One thing I noticed is that the customization options allow you to add text, images, tables, and more. Finally, when I executed the command, the PDF was automatically downloaded to my laptop.
pdf.output(r"C:\Your\Desired\Path\financial_report.pdf")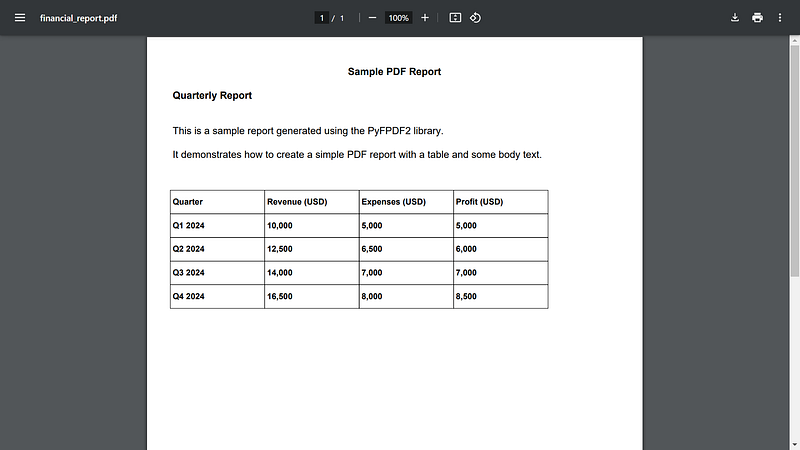
Hey there, I’m Ajay — a passionate engineer, writer on Medium, and a huge Python enthusiast. Thanks for sticking with me till the end! If you enjoyed this content and want to support my work, the best ways are:
- Drop a Clap 👋 and share your thoughts 💬 below!
- Follow me here on Medium.
- Connect with me on LinkedIn.
- Follow me on X here
- Join my email list so you never miss another article.
- And don’t forget to follow Top Python Libraries for more stories like this.
Thanks again for reading! 😊


