
8 Use Cases of Lambda and Apply functions in Pandas
Use Lambda and Apply in your next Data Science Project

Pandas is one of the most used libraries for performing data manipulation tasks in python.
I have been using Pandas for more than 5 years now and it amazes me how flexible it is — there are n-number of ways to implement something based on what you want to achieve — whether you want your code to be faster or shorter.
Lambda and Apply functions are one such powerful functions that I use a lot. They can make the code very crisp by converting multi-line codes into one-liners.
Some background about the Lamba and Apply functions:
- The lambda function is used to create one-liner functions in python.
### Lambda function to multiple variables by 2.
lambda x: x*2
2. Apply function is a one-liner alternative to loops in python.
### Using ‘apply’ function to implement a function 'func' on the rows of the dataframe.
DataFrame.apply(func, axis=0)
This blog will take you through various practical use cases where you can use apply and lambda functions in pandas, especially if your dataset is not too big.
Let’s quickly get started with the use cases:
USE CASE 1: Adding a numeric value to columns
Starting off with a very basic example where we will learn how to add values to the columns of a DataFrame.
import pandas as pd

# Define a lambda function that adds 10 to each element of a DataFrame
add_10 = lambda x: x + 10

# Create a DataFrame
df = pd.DataFrame({'A': [1, 2, 3], 'B': [4, 5, 6]})

# Apply the lambda function to each element of the DataFrame
df.apply(add_10)
# one line implementation:  df.apply(lambda x: x + 10)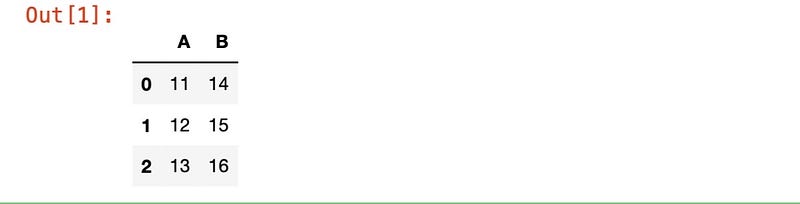
USE CASE 2: Max/Min of columns/rows
We can use the ‘apply’ method on a DataFrame to apply a lambda function that can find the maximum or minimum of values within columns or rows of a DataFrame.
# Create a DataFrame
df = pd.DataFrame({'A': [1, 2, 3], 'B': [4, 5, 6]})

# Define a lambda function that calculates the maximum of each row or column of a DataFrame
max_value = lambda x: x.max()

# Apply the lambda function to each row of the DataFrame
df.apply(max_value, axis=1)

# Apply the lambda function to each column of the DataFrame
df.apply(max_value, axis=0)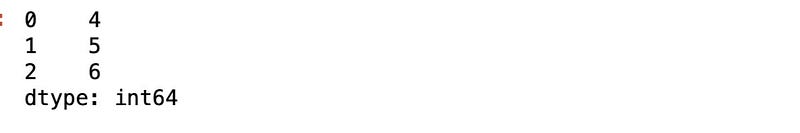
USE CASE 3: Difference between min and max of each column
We can also use apply with lambda to find the difference between the minimum and maximum values within each column of the DataFrame.
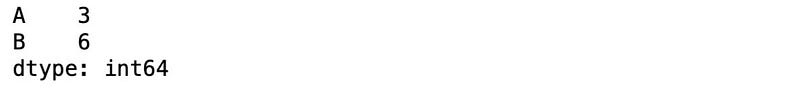
In the below example, for column ‘A’, the lambda function calculates the maximum as 3 and the minimum as 1, giving the output as 2. Similarly, it outputs 2 for column ‘B’ too.
# Define a lambda function that calculates the difference between the maximum and minimum value of each column in a DataFrame
range = lambda x: x.max() - x.min()

# Create a DataFrame
df = pd.DataFrame({'A': [1, 2, 3], 'B': [4, 5, 6]})

# Apply the lambda function to each column of the DataFrame
df.apply(range)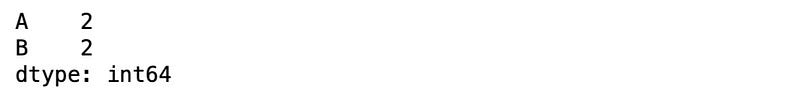
USE CASE 4: String Manipulation
Many times, while working with the string columns, we need to perform data manipulation such as converting strings to lowercase, splitting the sentences into words, string replacement, etc.
In this example, we will look at one such use case where we will convert string values within the columns of a DataFrame into lowercase.
# Define a lambda function that converts a string to lowercase
to_lower = lambda x: x.str.lower() if isinstance(x, object) else x

# Create a DataFrame
df = pd.DataFrame({'A': ['A', 'B', 'C'], 'B': ['X', 'Y', 'Z']})

# Apply the lambda function to each element of the DataFrame
df.apply(to_lower)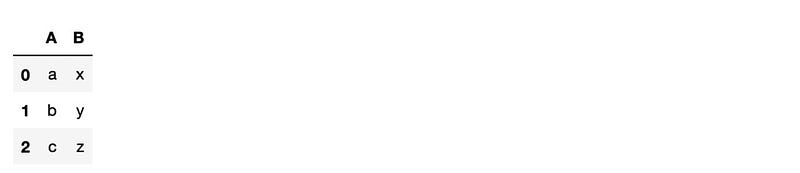
USE CASE 5: Normalisation of variable
Data normalization is a very important step before applying machine learning algorithms such as K-means.
In the below example, we are using apply method with the lambda function to normalize the values within the columns of a DataFrame.
# Define a lambda function that normalizes the values of a DataFrame
normalize = lambda x: (x - x.mean()) / x.std()

# Create a DataFrame
df = pd.DataFrame({'A': [1, 2, 3], 'B': [4, 5, 6]})

# Apply the lambda function to each element of the DataFrame
df.apply(normalize)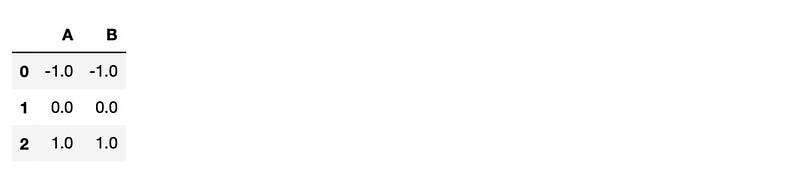
USE CASE 6: Replace missing values
Data cleaning is a crucial pre-processing step before performing the data analysis.
Missing value treatment is part of the data cleaning process that can be implemented using apply and lambda functions (as shown below).
# Define a lambda function that replaces missing values in a DataFrame with a specified value
replace_missing = lambda x, value: x.fillna(value)

# Create a DataFrame
df = pd.DataFrame({'A': [1, 2, None], 'B': [None, 5, 6]})

# Apply the lambda function to each element of the DataFrame
df.apply(replace_missing, args=(0,))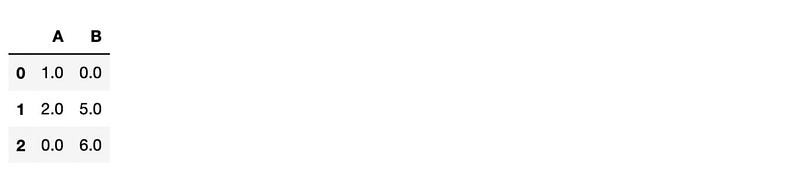
USE CASE 7: Cumulative Sum
We can also find the cumulative sum of columns of a pandas DataFrame using the apply and lambda function as shown below.
# Define a lambda function that calculates the cumulative sum of each column in a DataFrame
cumsum = lambda x: x.cumsum()

# Create a DataFrame
df = pd.DataFrame({'A': [1, 2, 3], 'B': [4, 5, 6]})

# Apply the lambda function to each column of the DataFrame
df.apply(cumsum)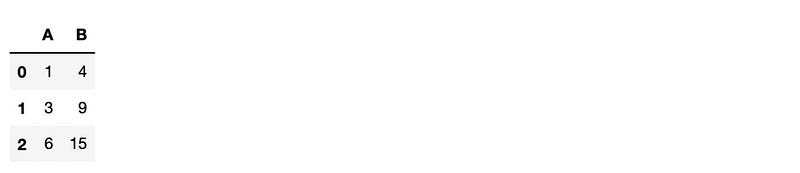
8. Moving Average
We can also use apply method with a lambda function to find the moving average of the columns of a DataFrame. This comes in very handy with time series data.
In the following example, we are finding the moving average with a window of 2 (looking at 2 consecutive rows at a time).
# Define a lambda function that calculates the moving average of each column in a DataFrame
moving_average = lambda x: x.rolling(window=2).mean()

# Create a DataFrame
df = pd.DataFrame({'A': [1, 2, 3], 'B': [4, 5, 6]})

# Apply the lambda function to each column of the DataFrame
df.apply(moving_average)
If the dataset is too big then the best practice is to use vectorized operations to manipulate the panda DataFrame. Read about vectorization here-
Conclusion
We looked at a variety of use cases where we can use lambda and apply functions while working with pandas. These functions can make our code concise and easy to follow.
When your dataset has millions of rows then you should not use lambda and apply but convert your code to vectorized form for faster execution.
Thank You for reading! I hope you liked it!
You can get all my posts in your inbox. Do that here!
If you like to experience Medium yourself, consider supporting me and thousands of other writers by signing up for a membership. It only costs $5 per month, it supports us, writers, greatly, and you get to access all the amazing stories on Medium.
Follow me to see my data science posts in your feed.