
7 Pandas Cheats That You’ve Probably Never Heard Of!
Discover Uncommon Tips for Pandas Library Mastery

“Data is like garbage. You’d better know what you are going to do with it before you collect it.” —
Mark Twain
Pandas, the Python library, not the bear, can be a treasure trove of secrets for the adept data wrangler.
I’m going to reveal seven lesser-known, yet incredibly powerful cheats that will transform the way you handle data in Python.
Pivot Like a Pro: Advanced Aggregations

Pandas pivot tables can be used for more than just simple reports. If you learn how to use pivot_table() with different aggregation methods, you can get a lot of different information from your data.
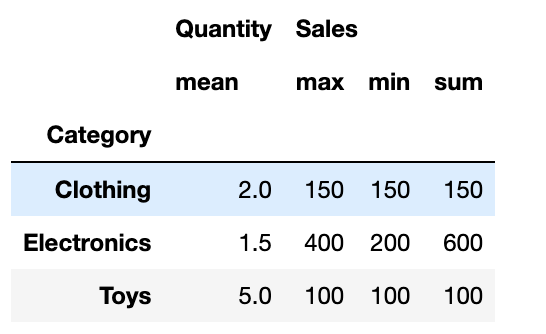
Consider a sales dataset to understand average sales, total count, and maximum product category sales. How to do it:
import pandas as pd

# Sample sales data
data = {
    'Category': ['Electronics', 'Clothing', 'Toys', 'Electronics'],
    'Sales': [200, 150, 100, 400],
    'Quantity': [1, 2, 5, 2]
}
df = pd.DataFrame(data)

# Advanced aggregation with pivot_table
advanced_pivot = df.pivot_table(index='Category',
                                values=['Sales', 'Quantity'],
                                aggfunc={'Sales': [min, max, sum], 'Quantity': 'mean'})

advanced_pivot
Here is the output.
In this example:
- We start with a DataFrame
dfcomprising categories, sales, and quantities. - Next, we use
index,values, andaggfunc. withdf.pivot_table(). - The
aggfuncparameter is where the magic happens. A dictionary with keys as column names and values as functions or preset strings like’mean’ can be sent.
This advanced pivot table helps in deep-diving into each category, providing a comprehensive view of your sales data.
Top-Tier Sorting: Mastering Nlargest and Nsmallest

Pandas’ nlargest() and nsmallest()methods swiftly find top and bottom data components. However, using the keep='all' argument ensures that all ties are included in your results, not just the first.
Here’s how you can use these functions effectively:
import pandas as pd
# Sample dataset of student scores
data = {'Student': ['Alice', 'Bob', 'Charlie', 'David', 'Eva'],
'Score': [88, 92, 88, 95, 90]}
df = pd.DataFrame(data)
# Find the top 3 scores, including all ties
top_scores = df.nlargest(3, 'Score', keep='all')
# Find the bottom 2 scores, including all ties
bottom_scores = df.nsmallest(2, 'Score', keep='all')
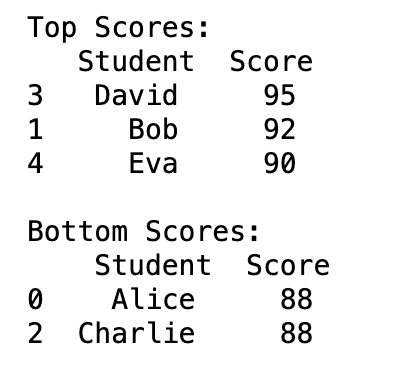
print("Top Scores:\n", top_scores)
print("\nBottom Scores:\n", bottom_scores)Here is the output.
In this example:
- We create a DataFrame,
df, with student scores. nlargest(3, 'Score', keep='all')fetches the top 3 scores, and due tokeep='all', it includes all students with tied scores.- Similarly,
nsmallest(2, 'Score', keep='all')retrieves the bottom 2 scores, considering ties.
This method works well for ranking and tie-based datasets like sports statistics and academic outcomes.
Transforming Data Magic: Leveraging Transform for Efficiency

Use Pandas’ df.transform() to boost data manipulation. This method is handy for applying sophisticated transformations to data groups while preserving the DataFrame structure.
Let’s see it in action:
import pandas as pd
# Sample dataset: Monthly sales per product
data = {'Month': ['Jan', 'Jan', 'Feb', 'Feb', 'Mar', 'Mar'],
'Product': ['A', 'B', 'A', 'B', 'A', 'B'],
'Sales': [200, 150, 210, 180, 250, 220]}
df = pd.DataFrame(data)
# Define a custom function to calculate growth
def calculate_growth(data):
return data / data.mean()
# Apply transform to Sales column
df['Growth'] = df.groupby('Month')['Sales'].transform(calculate_growth)
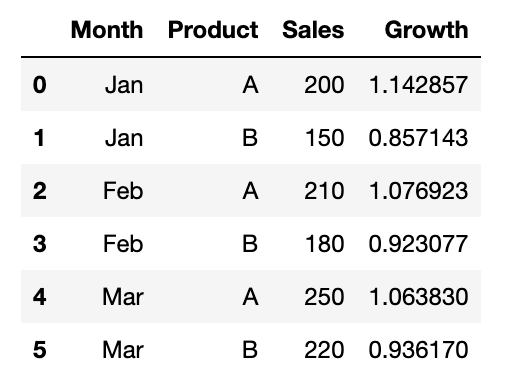
dfHere is the output.
In this example:
- We created a DataFrame with sales data by month and product.
- We defined a custom function
calculate_growth, which calculates sales growth relative to the monthly average. - We used
df.transform()to apply this function to the 'Sales' column, grouped by 'Month'. - This enriches our DataFrame with a new column ‘Growth’, showing how each product’s sales compare to the average monthly sales.
When you need to apply sophisticated computations within groups while preserving the DataFrame structure, this solution is game-changing.
Slicing with Style: IndexSlice for Multi-Level Data

Pandas’ complicated, multi-level index data might be difficult to navigate. With pd.IndexSlice, this approach is easier and more straightforward. This program makes hierarchical index slicing precise and easy, making data analysis faster and easier.
Let’s explore an example to understand its utility:
import pandas as pd
# Creating a multi-level DataFrame
data = {'Category': ['Fruit', 'Fruit', 'Vegetable', 'Vegetable'],
'Type': ['Apple', 'Banana', 'Carrot', 'Beans'],
'Price': [3, 2, 4, 5]}
df = pd.DataFrame(data)
df.set_index(['Category', 'Type'], inplace=True)
# Sort the index for efficient slicing
df.sort_index(inplace=True)
# Using IndexSlice for precise slicing
idx = pd.IndexSlice
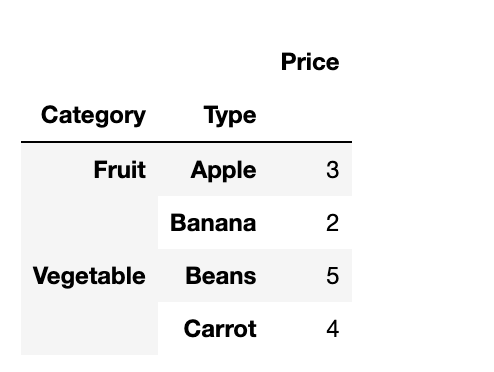
sliced_data = df.loc[idx['Fruit':'Vegetable', 'Apple':'Carrot'], :]
sliced_dataHere is the output.
In this example:
- We form a DataFrame with a multi-level index of
CategoryandType. - To enable error-free slicing, we sort the DataFrame using
df.sort_index(). - Utilizing
pd.IndexSlice, we slice the DataFrame across both index levels. - This yields a targeted section of our DataFrame, showing
IndexSlice's utility in managing complex data structures.
Mastering IndexSlice boosts your ability to skillfully handle multi-index data, leading to more precise data analysis.
Chain Your Data: Method Chaining Mastery

Pandas method chaining simplifies data processing. Multiple methods are called in sequence, each acting on the preceding one. You can manipulate data more efficiently and interpret your code better.
Here’s a practical example to demonstrate method chaining:
import pandas as pd

# Sample data
data = {'Name': ['Alice', 'Bob', 'Charlie'],
        'Age': [25, 30, 35],
        'City': ['New York', 'Los Angeles', 'Chicago']}

df = pd.DataFrame(data)

# Using method chaining for data transformation
transformed_df = (df
                  .assign(AgeGroup=lambda x: pd.cut(x['Age'], bins=[20, 30, 40], labels=['20s', '30s']))
                  .groupby('AgeGroup')
                  .agg({'Age': 'mean', 'City': 'count'})
                  .rename(columns={'Age': 'Average Age', 'City': 'Count'}))

transformed_df
Here is the output.
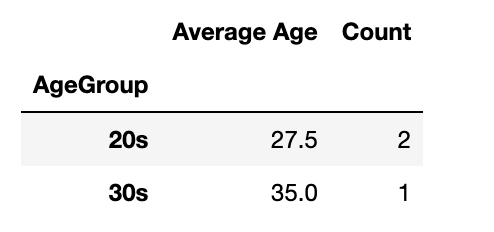
In this code:
- We start with a basic DataFrame.
- The
assign()method is used to create a new column, 'AgeGroup', categorizing ages. - We then chain
groupby()andagg()to compute the mean age and count cities within each age group. - Finally,
rename()is used to make the column names more descriptive.
Method chaining like this results in cleaner, more intuitive code, making complex data transformations simpler to follow and maintain.
Elegant Data Loading: Custom Converters in Action

Loading management helps speed up data processing and improve analysis. Pandas’ custom function provide instant data transformation during import in pd.read_csv(). This functionality is handy for customizing data.
For our dataset, “organizations-100000.csv,”, from here, we’ll focus on anonymizing organization names and categorizing them by the number of employees. Here’s the approach:
import pandas as pd

# Path to the CSV file
file_path = '/path/to/organizations-100000.csv'

# Custom converter functions
def anonymize_org_name(name):
    return "Organization " + str(hash(name))

def categorize_employees(number):
    try:
        num = int(number)
        if num < 100:
            return 'Small'
        elif num < 1000:
            return 'Medium'
        else:
            return 'Large'
    except ValueError:
        return 'Unknown'

# Custom converters
converters = {'Name': anonymize_org_name, 'Number of employees': categorize_employees}

# Reading CSV with custom converters
df = pd.read_csv(file_path, converters=converters)

df.head()
Here is the output.
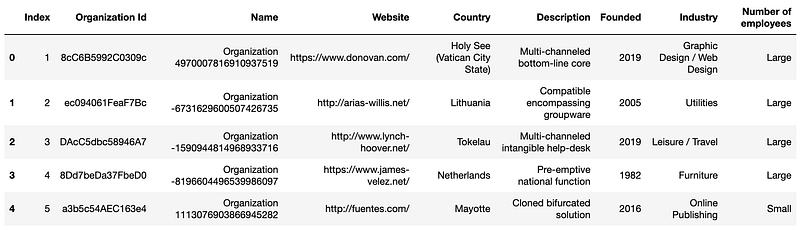
In this snippet:
- We anonymize the ‘Name’ column using
anonymize_org_name, which hashes the original names for privacy. - The
categorize_employeesfunction classifies organizations based on their employee count into 'Small', 'Medium', or 'Large'. - These converters are applied as the data is loaded, efficiently preprocessing the specified columns.
Pandas’ custom converters instantly modify the dataset to our analytical needs, proving their power and ease. This method manages huge datasets with data consistency and privacy from the start.
Master the Art of Conditional Column Creation

Data manipulation sometimes involves creating DataFrame columns depending on criteria. Pandas’ np.select() method simplifies this. It’s great for applying complicated logic to produce new, relevant data columns.
Let’s add a column to “organizations-100000.csv” that categorizes organizations by founding year and staff count. This can reveal organization development and founding tendencies.
Here’s how:
import pandas as pd
import numpy as np

# Path to the CSV file
file_path = '/path/to/organizations-100000.csv'

# Reading the CSV file
df = pd.read_csv(file_path)

# Conditions for new column 'OrgCategory'
conditions = [
    (df['Founded'] < 2000) & (df['Number of employees'] > 1000),
    (df['Founded'] >= 2000) & (df['Founded'] < 2010) & (df['Number of employees'] <= 1000),
    (df['Founded'] >= 2010)
]

# Choices corresponding to above conditions
choices = ['Established-Large', 'Mid-Age-Small/Medium', 'New-Age']

# Creating the new column using np.select
df['OrgCategory'] = np.select(conditions, choices, default='Other')

df.head()
Here is the output.
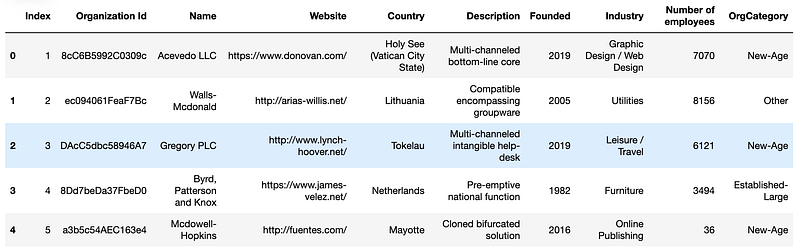
In this code:
- We define a set of conditions to categorize organizations.
- Corresponding choices are provided for each condition.
np.select()is used to create the 'OrgCategory' column, based on these conditions and choices.
This clean and quick method adds categorical data from existing data to your dataset. Such categorizations aid analysis and understanding.
Final Thoughts
In this one, we uncovered advanced techniques like pivot table mastery, efficient sorting methods, and transformative data handling in Pandas. These tips not only enhance your data wrangling skills but also streamline your Python coding experience.
By subscribing to LearnAIWithMe on Substack, you’ll gain more insights like these and keep your skills sharp in the rapidly evolving world of AI and data science.
Don’t miss out on weekly AI Pulse, our #LearnAI series, specialized GPT guides for unique tasks, data project generation, comprehensive cheat sheets, and much more — all designed to elevate your AI journey.
Free GPT’s and Resources
Here are our free GPT’s and projects files you can take advantage.
- Staying Updated With Daily AI News- https://chat.openai.com/g/g-35enG4y1L-ai-news
- Staying Updated With ChatGPT News — https://chat.openai.com/g/g-VQMLTd4SE-gpt-news
- To write articles ; https://chat.openai.com/g/g-GJdH0BxMk-phoneixink
- To correct your articles vocabulary ; https://chat.openai.com/g/g-KddNRhCNe-vocabulary-correcter
Here is the ChatGPT cheat sheet.
Here is my NumPy cheat sheet.
Here is the source code of the “How to be a Billionaire” data project.
Here is the source code of the “Classification Task with 6 Different Algorithms using Python” data project.
Here is the source code of the “Decision Tree in Energy Efficiency Analysis” data project.
Here is the source code of the “DataDrivenInvestor 2022 Articles Analysis” data project.
“Machine learning is the last invention that humanity will ever need to make.” Nick Bostrom
Visit us at DataDrivenInvestor.com
Subscribe to DDIntel here.
Have a unique story to share? Submit to DDIntel here.
Join our creator ecosystem here.
DDIntel captures the more notable pieces from our main site and our popular DDI Medium publication. Check us out for more insightful work from our community.
DDI Official Telegram Channel: https://t.me/+tafUp6ecEys4YjQ1


