
7 Best Tracing Tools for Microservices
As the complexity of microservices architectures increases, it becomes more challenging to identify the root cause of issues when they arise. Logs and metrics give us helpful information but do not provide a complete picture of the system. That is where tracing comes in. Through tracing, developers can monitor the progress of requests across microservices, allowing them to spot and resolve issues earlier.
In this article, I will explore the benefits of tracing and highlight seven of the best tracing tools available, including Helios, DataDog, Honeycomb, Jaeger, Zipkin, New Relic, and Splunk. So let’s dive in and discover how these tools can help us better manage and monitor our microservices.
What is Tracing?
Tracing is an essential part of distributed systems that involves monitoring and gathering the data flow and responses across different services and modules. In the microservices architecture, a request is passed through multiple services with different functionalities. Tracing allows developers to track the request paths to identify the source of potential issues and capture information such as timing, latency, performance insights, and service dependencies.
Benefits of using Tracing
Using tracing can bring many benefits to your microservices architecture:
- Identifying performance issues: Tracing helps identify performance issues by providing a detailed view of the execution path of a request across microservices. This enables programmers to locate and fix the system’s bottlenecks, slow endpoints, and other performance issues.
- Debugging: Tracing provides a detailed view of the interactions between microservices, helping developers debug and diagnose issues more effectively.
- Monitoring: Tracing offers real-time monitoring of microservices, helping to identify issues before they become critical. This allows developers to proactively address issues before they impact users.
- Understanding dependencies: Tracing helps understand the dependencies between microservices, providing insight into how changes in one service can affect others.
- Scaling: Tracing helps identify performance bottlenecks and inefficiencies, making it easier to scale and handle more traffic without impacting performance.
- End-to-end visibility: Tracing provides end-to-end visibility of the entire system, allowing for a comprehensive view of the system’s health and performance. This helps developers and operators understand the system’s functions and identify areas requiring attention.
7 Best Tracing Tools for Microservices
Here are the seven best tracing tools for microservices that you should consider:
1. Helios
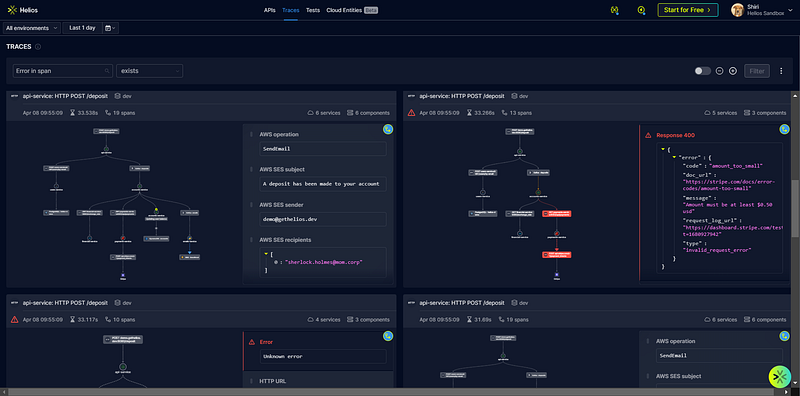
Helios is a developer platform that provides actionable insights into your end-to-end application flows. It is based on OpenTelemetry’s context propagation framework and provides end-to-end visibility across microservices, serverless functions, databases, and 3rd party APIs. For more details, check out their sandbox or use it for free by signing up here.
Features of Helios
- Helios provides distributed tracing information of your microservices in full context. It can be considered a single source of truth for the data flow of your application.
- Users can easily identify performance bottlenecks by analyzing payloads and error data.
- Can easily integrate with existing tools.
- Allows to reproduce exact workflows like Lambda invocations. HTTP requests, Kafka, and RabbitMQ messages.
- Support multiple languages, including Python, JavaScript, Node.js, Java, Ruby, .NET, Go, C++, and Collector.
- Support automatic test generation based on trace data.
2. DataDog
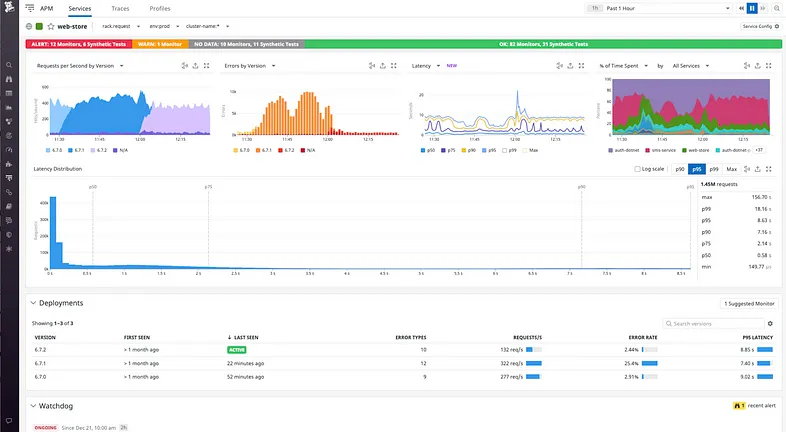
DataDog is a popular cloud-based monitoring platform that allows you to monitor microservices with a wide range of metrics, logs, and traces. It provides real-time visibility into your system’s behaviors, ensuring a clear picture of your system’s operational health.
Features of DataDog
- Provide anomaly detection to get automatically notify users of abnormal behavior.
- Support visualizing services, service dependencies, and locations.
- Users can analyze traces and drill down into metrics to easily identify the root causes of issues.
- Support up to 50 traces per APM host.
- Support multiple could support vendors, including AWS, Azure, and GCP.
3. Honeycomb
Honeycomb is another popular tool that offers distributed tracing for microservices. It provides real-time analysis to give immediate insight and supports anomaly detection to show the spans with bad user experience. For more details, check out their sandbox.
Features of Honeycomb
- Anomaly detection support.
- Users only have to pay for what they use (pay-as-you-go pricing).
- Instrumentation with no vendor lock-in.
- Support multiple programming languages, including Python, Java, Ruby, and Go.
4. Jaeger
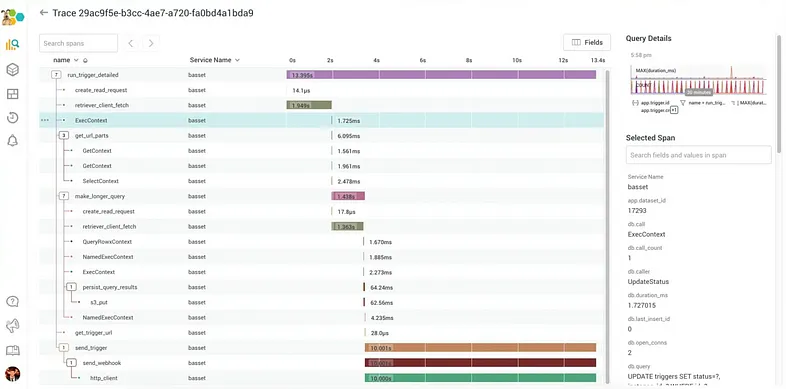
Jaeger is a powerful, open-source distributed tracing system designed to monitor and troubleshoot microservices-based distributed systems. It is capable of handling vast amounts of data with the help of its scalable and flexible architecture, providing an unparalleled level of performance.
Find more details on Jeager here.
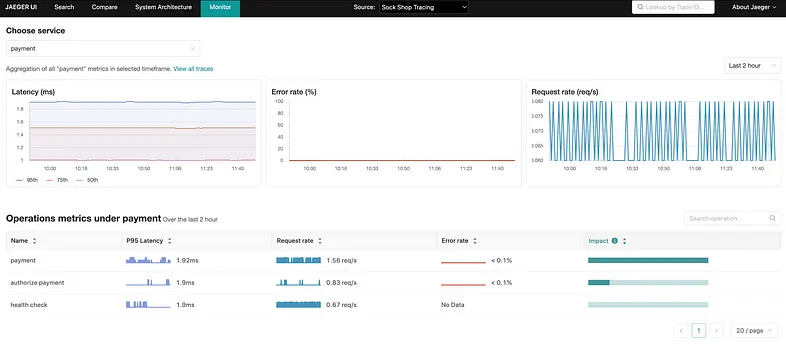
Features of Jaeger
- Jaeger is an open-source solution that is freely available to anyone.
- Offers advanced search and visualization features to understand the flow of requests and identify bottlenecks or issues in your system.
- Support Elasticsearch for data persistence.
- Provides Prometheus metrics by default.
- Using Jaeger UI, users can easily filter traces based on services, duration, and tags.
5. Zipkin
Zipkin is another popular open-source distributed tracing solution. It was initially developed by Twitter to gather their timing data to troubleshoot latency issues and is now maintained by the OpenZipkin community.
You can easily set up Zipkin with Docker or Java.
// Docker
docker run -d -p 9411:9411 openzipkin/zipkin

// Java
curl -sSL https://zipkin.io/quickstart.sh | bash -s
java -jar zipkin.jar

// From Source
# get the latest source
git clone https://github.com/openzipkin/zipkin
cd zipkin
# Build the server and also make its dependencies
./mvnw -DskipTests --also-make -pl zipkin-server clean install
# Run the server
java -jar ./zipkin-server/target/zipkin-server-*exec.jar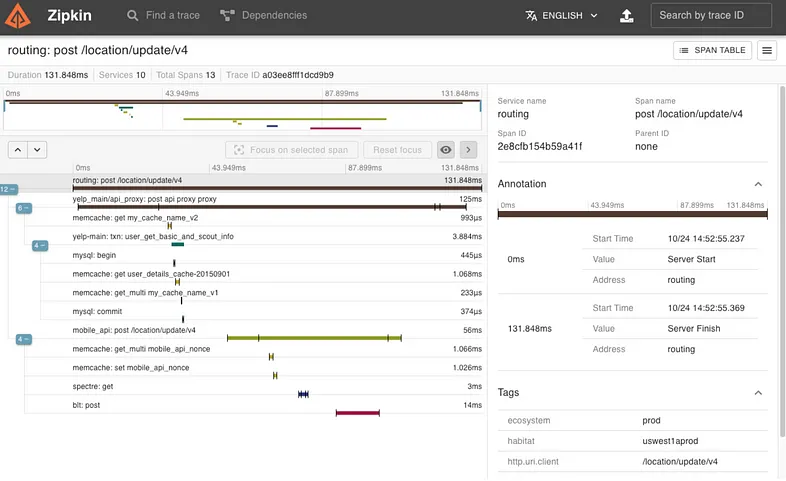
Features of Zipkin
- Provides a web-based user interface for visualizing trace data.
- Users can filter traces based on service name, time range, etc.
- Provides visualizations like dependency graphs and flame graphs.
- Support integrations with various tools like logging and metrics platforms.
- Open-source.
6. New Relic
New Relic is a top-notch monitoring platform that provides a complete set of tools to monitor distributed microservices. It goes beyond mere monitoring, as it offers real-time visualization and in-depth analysis of your system’s performance. Furthermore, its “New Relic Edge service” is specialized for distributed tracing and can observe 100% of an application’s traces.
You can get started with New Relic for free.
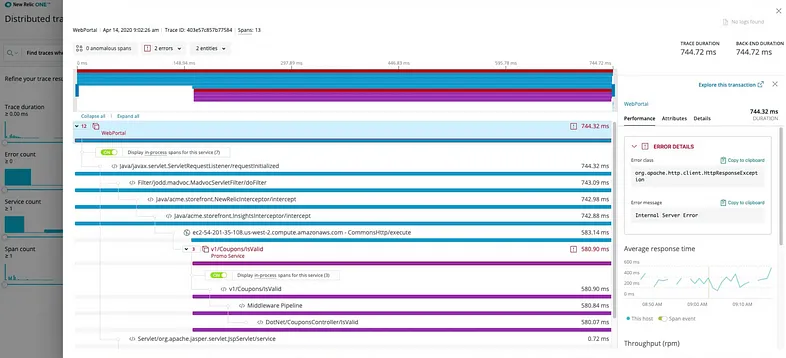
Features of New Relic
- Support all major cloud services providers like AWS, Azure, and GCP.
- Users can drill down into the metrics and traces to analyze the root cause of issues.
- Provides a holistic view of the logs by collecting, processing, and analyzing data from multiple resources.
- Support OpenTelemetry.
- Easy setup with a single agent to instrument the entire application automatically.
7. Splunk
Splunk is a powerful and flexible distributed tracing tool for monitoring and troubleshooting issues in distributed systems. Whether you’re tracking the performance of microservices or monitoring a complex network, leveraging Splunk can ensure that your systems run smoothly while minimizing downtime and optimizing overall performance.
You can get started with Splunk for free.
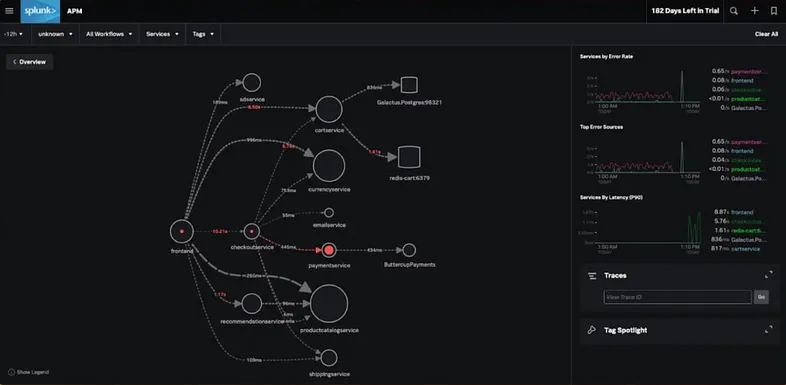
Features of Splunk
- Uses an AI-driven service to identify microservices with errors.
- Provide end-to-end visibility across your applications.
- Can ingest multiple formats like JSON, XML, and unstructured data.
- Provides an attractive dashboard with charts, reports, pivots, etc.
- Indexes data to provide faster search and query capabilities.
Conclusion
Tracing has become a crucial part of today’s complex microservices architectures to monitor and troubleshoot issues in real time. It provides a complete system overview, allowing developers to identify potential issues before they become critical, optimize performance, and improve overall reliability.
This article discussed the benefits of tracing and reviewed seven leading tracing tools, including Helios, Splunk, Jaeger, and Zipkin. Although they share a common goal, each of these tools has its own unique features and strengths. So, make sure to choose the tool that best fits your needs.


