
10 Best D3.js Online Courses and Books to Learn Data Visualization in 2023
My favorite online courses and books to learn D3.js from Udemy, Coursera, Pluralsight, and Codecademy

Hello folks, If you have done any Data visualization work, you might have heard about D3 — one of the excellent JavaScript libraries which allows you to create beautiful interactive data visualization for the web. It’s prevalent among Data Scientists and Data Analysts who often need these visualizations and charts to present data insights to stakeholders and business people.
If you are not familiar with D3, no need to worry because, In this article, I will share some of the awesome courses to learn D3 in 2023. These courses teach you the basics of data visualization with D3 by binding data to a web page’s elements and customizing the elements based on that very data.
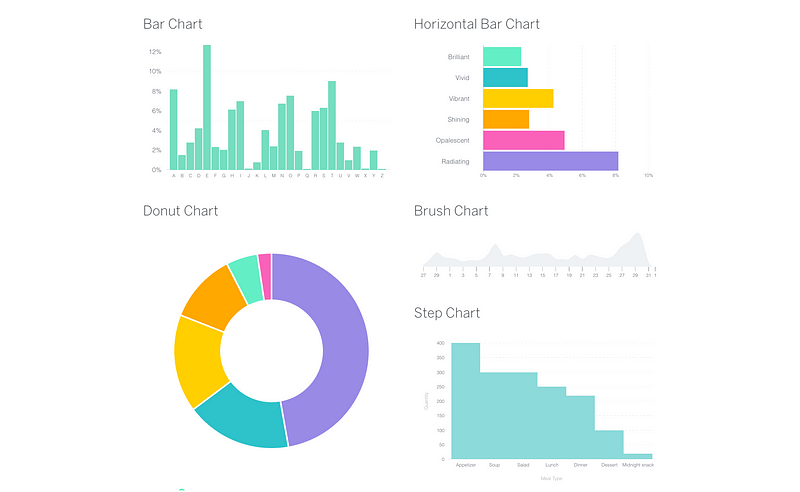
You will also learn how to build different kinds of charts, like Bar charts, Pie charts, Mind maps, etc, using D3.js Let’s start with the full form of D3.js; D3 stands for Data-Driven Documents. It is a JavaScript library for Data Visualization and quite popular among Data Scientists, Statisticians, Mathematicians, Analysts, and anyone wanting to take raw data and create visually appealing graphs and Data-Driven Visualizations such as:
- Bar Charts
- Pie Charts
- Line Graphs
- Bubble Packs
- Tree Diagrams and more
Effective visualization helps users analyze and reason about data and makes complex data more accessible, understandable, and easy on the eye!
Why D3.js is best for Data Visualization?
D3 is not the only option when it comes to data visualization libraries and tools for the web; you also have FusionCharts, HighCharts, charts.js, and even Google Developers Charts and tools like Tableau for Data Scientists, but what sets D3.js apart from these is its flexibility, Elegance, and Community. D3 is very flexible in loading data from different sources and helps you to make unique visualization. You can make a completely new visualization that has never been imagined before using D3.js. It’s also elegant as you can create awesome visualization, but its most important strength is the community. A huge community of D3 developers can support you if you are stuck.
There is also a lot of existing code to create a visualization you want; this really makes it easy to create Data visualization using D3.js.
A picture is worth a thousand words, which was never more true than with data visualizations and D3.js.
10 Best Online Courses and Books to Learn D3.js for Beginners in 2023
Now that you know how good D3.js is, check out some of the best courses you can take to learn and master D3 in 2023. Keeping different learning styles in mind like interactive learning, project-based learning, and audio-visual learning.
I have chosen courses that provide the right mix of these types. All the courses are great and provide an amazing learning experience with an enthusiastic instructor and awesome content.
1. D3.js Data Visualization Fundamentals — Hands-On
This is the best hands-on course to learn D3.js in 2023 for Data Visualization with JavaScript. This course will help you design and build beautiful data visualizations with d3.js using a practical hands-on approach to learning the D3 library.
Here are the main things you will learn in this course:
- Learn the fundamentals of D3
- Gain a wide variety of knowledge, learning how to different visualizations like bars, charts, etc.
- Develop stunning web pages with loads of visualizations on a single page
- Create stunning data visualizations using D3 and SVG
- Use scales to help make your visuals work on any browser or device.
Talking about social proof, more than 11,677 people have joined this course, and it is one of the highest-rated courses on Udemy to learn D3.js, with on average 4.8 rating forms close to 1870 participants, which is impressive.
Here is the link to join this course — D3.js Data Visualization Fundamentals — Hands-On

2.. Mastering data visualization in D3.js [Udemy Best Course]
This is another best online course if you want to design and build beautiful data visualizations with d3.js. Adam Jones, the course instructor, provides a comprehensive introduction to the D3 library. The course starts covering D3 fundamentals, and then it covers advanced data dashboard visualizations in 7 hours. This makes any beginners follow him and build their dynamic and interactive charts using D3.js. It’s also a very hands-on course, and you will build a couple of projects along the way, which is great to consolidate your learning and apply the knowledge you have learned. He is also very helpful and replies to questions on Q & A, all the time. The course has more than 8,790 students enrolled in it about social proof. It also has, on average, 4.4 ratings from close to 1600 ratings which is amazing.
Here is the link to join this course — Mastering data visualization in D3.js

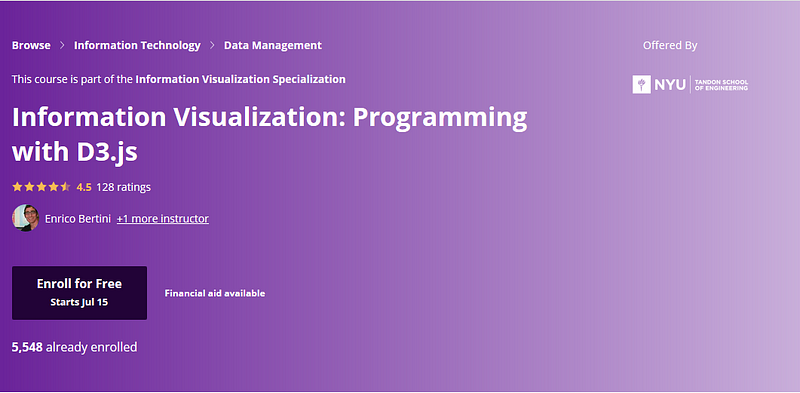
3. Information Visualization: Programming with D3.js [Coursera]
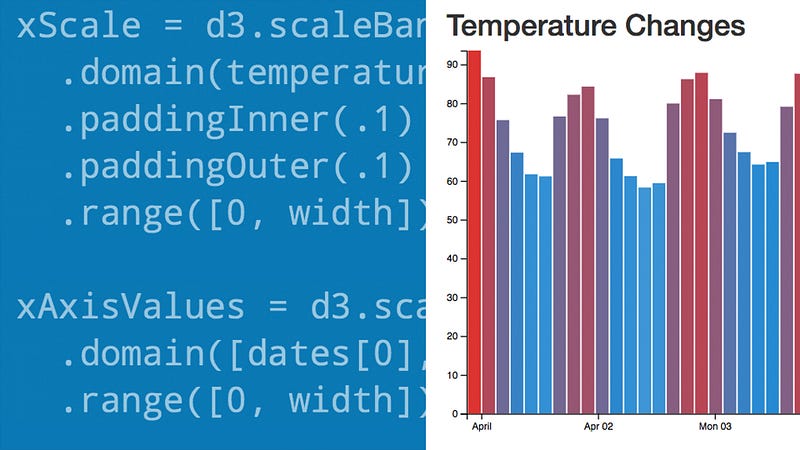
In this free course on Coursera, you will learn how to use D3.js to create powerful visualizations for the web. Learning D3.js gives you the freedom to create something as simple as a bar chart or design some unique visualization which never exists. The course has the right mix of theory and practice and provides a step-by-step guide on using this library to build actual visualizations and understand the theoretical concepts behind them.
This course is also part of the Information Visualization Specialization, which contains more relevant courses to master Data Visualization. Like other Coursera courses, this one is also free-to-audit, and you only need to pay if you need a certificate or want to access quizzes and assessments. The best thing about this Coursera D3 course is that you will build a fully working visualization system to visualize airline routes by applying the skills you have learned in this course.
Here is the link to join this course —Information Visualization: Programming with D3.js
By the way, if you find Coursera courses useful, which they are because they are created by reputed companies like Google, IBM, Amazon, and the best universities around the world, I suggest you join Coursera Plus, an annual subscription plan from Coursera.
This single subscription gives you unlimited access to their most popular courses, specialization, professional certificate, and guided projects. It cost around $399/year but it's completely worthy of your money as you get unlimited certificates.
4. Learn D3 course on CodeCademy
This is a great interactive course on CodeCademy Pro that will teach you how to use D3 for drawing charts and visualization. It’s a short but power-packed course of 2 hours which contains interactive lessons on D3. The course also has Multiple choice quizzes and a project to teach you how to use D3 for drawing meaningful visualization. There is a good chance that you already have a CodeCademy Pro membership, which means you can use this course for FREE. But, if you don’t have one, I suggest you get one because CodeCademy is home to some of the best interactive courses to learn the latest technologies and programming languages like Python, Java, SQL, Data Science, etc. Their pro membership costs around $16 per month which you can recover by skipping coffee for two days — also a healthy thing to do :-)
Here is the link to join this D3.js course —Learn D3
5. Build Data Visualizations with D3.js & Firebase
This is another course on Udemy, which is great for learning how to use D3 and Firebase to create dynamic SVG data visualizations, Bar charts, and pie charts. Created by The Net Ninjam, in this course, I’ll teach you how to harness the power of D3 to create a variety of different data-driven visualizations such as bar charts, pie charts, line graphs, bubble packs, and tree diagrams. You’ll also learn about D3 selection, changing SVG attributes & styles, scales, axes, transitions, hierarchical data, and other important D3.js concepts. Talking about social proof, more than 3300 people have trusted this course with a 4.6 average rating, making it one of the highest-rated courses to learn D3.js on Udemy.
Here is the link to join this course —Build Data Visualizations with D3.js & Firebase
6. Getting Started with D3 By Chris Behrens [Pluralsight Course]
This is another great course to learn D3.js but on Pluralsight. If you have Pluralsight membership, you can use this course to learn D3.js quickly. In this course, you will learn the foundations of how D3 creates data visualizations with SVG (Scalable Vector Graphics). Next, you will discover how to create a powerful line chart that you can adapt to your work. Finally, you will explore how to create powerful hierarchical diagrams with force-directed layouts and how to communicate real-world data with geographic visualizations. After completing this course, you will have the skills and knowledge of D3 and data visualization needed to get your data into pictures where it belongs.
Here is the link to join this course — Learn and Understand D3.js for Data Visualization
The only catch is that you need a Pluralsight membership to access this course which costs around $29 per month or $299 per year. They are also offering a 33% discount now for 2 days, which means you can get this subscription for just $199 for one year.
It’s definitely worth the money as you get access to more than 7000+ technical and non-tech courses on their site and I believe every developer should have this kind of membership. Just in case if you are not ready yet, they also offer a 10-day free trial which is enough to access this course for free.
7. D3 Tips and Tricks: Interactive Data Visualization [Educative]
If you are looking for text-based, interactive courses to learn D3.js, then this D3.js course from Educative is perfect for you. Educative is a relatively new online learning platform which allows you to run code on a browser, thus making it easy for you to learn.
In this D3.js beginner course, you will start your journey into D3 with a simple line graph. You will learn to break the example down into its components and create variations of the graph by individually tinkering with each component.
After that, you will dive into how to draw elements in D3, such as geometric shapes and paths. In addition, you will learn to apply various styles to these elements and adjust their attributes.
Along the way, you will get hands-on experience using the techniques to visualize bar charts, histograms, tree diagrams, and more. By the end of this course, you will have a decent knowledge of D3.js to explore further.
Here is the link to join this course — D3 Tips and Tricks: Interactive Data Visualization
And, if you find the Educative platform and their interactive courses useful, you can also get an Educative Subscription that provides access to not just this course but their 210+ courses for just $14.9 per month. It’s very cost-effective and great for getting some hands-on learning experience.
8. Learning Data Visualization with D3.js [LinkedIn Learning]
If you are a data scientist or aspiring to become a data scientist and looking for an amazing course to learn Data Visualization with D3.js in 2023, then this course from LinkedIn Learning, a popular online learning platform, is a great one to start with.
The D3.js library has revolutionized Data visualization by making it easier to parse your data and add meaningful interactivity. You can also bring your data to life using D3, a bit of HTML, CSS, JavaScript, and some SVG graphics.
In this course, you will not only learn how the D3 library works but also how you can use it to parse data from different sources and create interactive, visually exciting infographics and visualizations.
You will learn basic concepts like controlling HTML with jQuery-Esque selections and modifying attributes through CSS — before moving on to working with SVG graphics, a top choice for graphics in D3 visualizations.
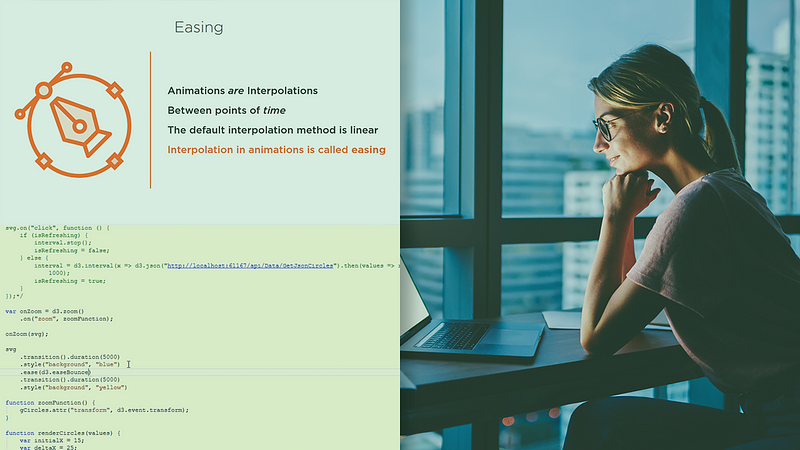
You will also be working with D3 methods like scaling, events, transitions, animations, and how to work with data, including connecting to external data sources, which is quite essential for Data scientists. Overall a great course to learn D3.js for Data Scientists.
Here is the link to join this course — Learning Data Visualization with D3.js
You would need a LinkedIn Learning membership to watch this course which costs around $19.99 per month, but you can also watch this course for FREE by taking their 1-month-free-trail which is a great way to explore their 16000+ online courses on the latest technology.
9. Fullstack D3 and Data Visualization [Best Book to learn D3.js]
If you like to read books apart from courses, you can also check out this awesome book to learn D3.js in depth. This book is created by Newline, author of Fullstack React and ng-book: The Complete Angular Guide, two of the best resources for Javascript developers to learn to React and Angular.
The Fullstack D3 course is the complete guide to D3. With dozens of code examples showing each step, you will gain new insights into your data by creating visualizations in this self-paced online course cum book.
Fullstack D3 is a self-paced, online course where you will learn how to master D3 and build beautiful, custom visualizations. You’ll start making charts right away and learn new concepts and design theory.
here is the link to join this course — Fullstack D3 and Data Visualization
If you like, you can also buy this book on Amazon Kindle, here is the link to Fullstack D3 and Data Visualization to Build beautiful data visualizations with D3.
10. Learn and Understand D3.js for Data Visualization [Udemy]
Another comprehensive course is to learn D3.js for Data Visualization using JavaScript on Udemy. This course is packed with 10 hours of high-quality content, 17 article, and more than 30 downloadable resources.
Here are the key skills you will learn in this course:
- How to create stunning data visualizations using D3 and SVG
- Build interactive map visualizations with GeoJSON
- Understand selections to manipulate the DOM using D3
- Learn about layouts to build various charts and graphs
- Add transitions and animations to your graphs for a more interesting user experience
- Use scales to help make your visuals work on any browser or device.
- Understand the enter and exist modes in D3
- How to create responsive charts and graph
In short, a perfect course to dive deep under the hood of D3.js. Learn core concepts and build stunning data visualizations using D3 version 6.x
Here is the link to join this course — Learn and Understand D3.js for Data Visualization
That’s all about some of the best online courses to learn D3 — the most popular JavaScript library for Data Visualization. These courses are carefully chosen and have the right mix of theory and practice.
You don’t need to join all the courses to learn D3; choose one of two where you can connect with the instructor. The first course on D3 is my favorite course and whatever I have learned on D3.js is mainly because of that course. Other Articles Programmers and Data scientists may like
- 10 Courses to Learn Data Science for Beginners
- Top 5 Courses to Learn Python in 2023
- Top 10 TensorFlow courses for Data Scientists
- 10 Free Courses to Learn Python for Beginners
- 5 Books to learn Python for Data Science
- Top 5 Free Courses to Learn Machine Learning
- 10 Machine Learning and Deep Learning Courses for Programmers
- 10 Reasons to Learn Python in 2023
- Top 5 Courses to Learn Tableau for Data Science
- Top 8 Python Libraries for Data Science and Machine Learning
- Top 5 Courses to Learn Advance Data Science
- Top 5 Courses to Learn TensorFlow for Beginners
Thanks for reading this article so far. If you like these D3 courses for Web developers, please share them with your friends and colleagues. If you have any questions or feedback, then please drop a note.
P. S. — If you are keen to learn D3.js for Data Visualization in JavaScript but looking for a free training course, you can also check out this How To Make A Pie Chart With D3.js course on Udemy. It’s completely free, and more than 2.5K people have joined this course. All you need is a free Udemy account to join this course.


