
Learn Precision, Recall, and F1 Score of Multiclass Classification in Depth
Manual calculation from a confusion matrix and the syntax of sklearn library
Precision, recall, and f1-score are very popular metrics in the evaluation of a classification algorithm. It is very easy to calculate them using libraries or packages nowadays. But I believe it is also important to understand what is going on behind the scene to really understand the output well.
If these concepts are totally new to you, I suggest going to this article first where the concepts of precision, recall, and f1-score are explained in detail.
This article will be focused on the precision, recall, and f1-score of multiclass classification models.
Precision
As a refresher, precision is the number of true positives divided by the number of total positive predictions. In other words, precision finds out what fraction of predicted positives is actually positive.
Here is the formula for precision:
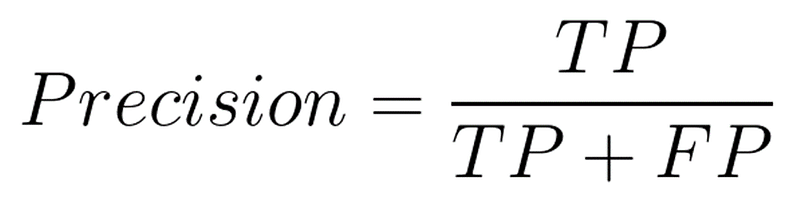
Here,
TP = True positives
FP = False positives
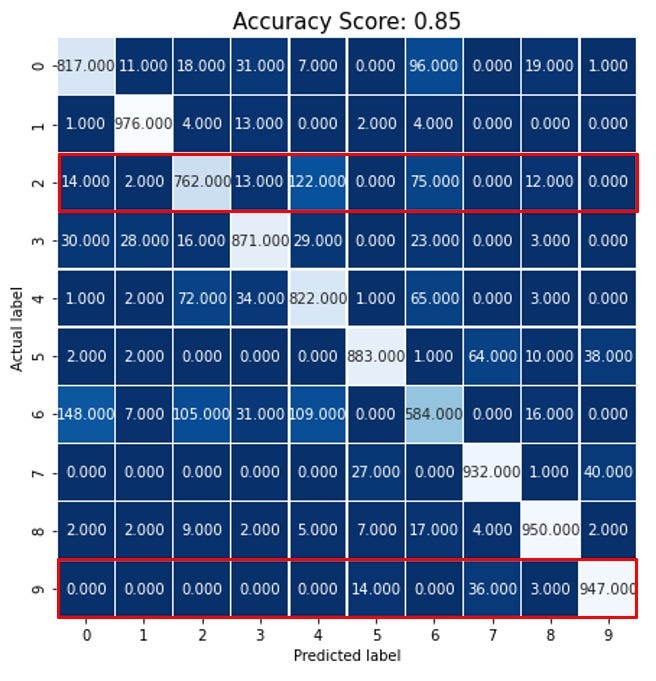
We will see how to calculate precision from a confusion matrix of a multiclassification model. Consider this confusion matrix:
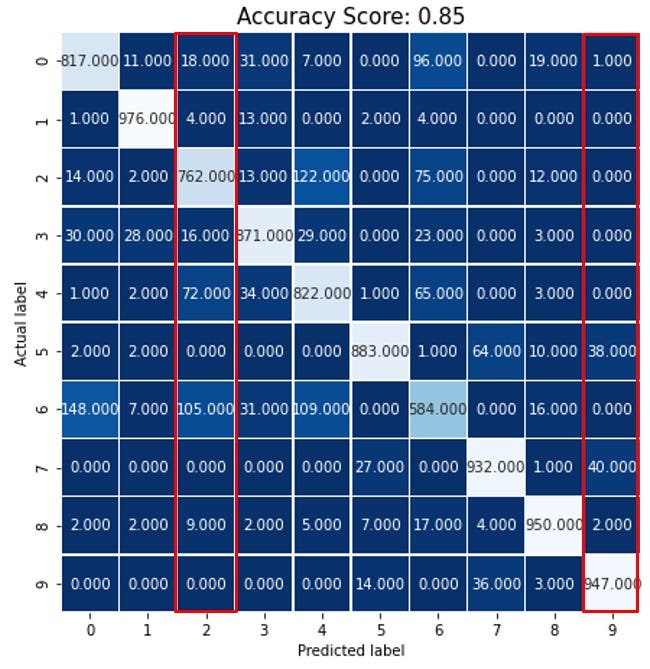
As you can see, this confusion matrix is a 10 x 10 matrix. Because this model has 10 classes. When we worked on binary classification, the confusion matrix was 2 x 2 because binary classification has 2 classes.
I expressed this confusion matric as a heat map to get a better look at where actual labels are on the x-axis and predicted labels are on the y-axis. The model has 10 classes that are expressed as the digits 0 to 9.
What are True Positives and False Positives here?
We will work on a couple of examples to understand it. Let’s take label 9 for a demonstration. True positive for label 9 should be the samples that are actually 9 and predicted as 9 as well. In the heatmap above, 947 (look at the bottom-right cell) is the True positive because they are predicted as 9 and the actual label is also 9.
Let’s see what is false positives. Look, When we are working on label 9, only label 9 is positive and all the other labels are negative. In the column where the predicted label is 9, only for 947 data, the actual label is also 9. The rest of the data in that column (marked in red) are falsely predicted as 9 by the model. The actual label is not 9 for them. So the false-positive for label 9 is (1+38+40+2).
Precision for label 9 is:
947/ (947 + 1 + 38 + 40 + 2) = 0.92
The precision for label 9 is 0.92 which is very high. Because it’s almost close to 1.
If the model is perfect, there shouldn’t be any false positives. If false-positive is 0, the precision will be TP/TP, which is 1.
We will work on one more example. Let’s calculate the precision for label 2 as well.
First, find that cross cell from the heatmap where the actual label and predicted label both are 2. Look at column 2. It’s 762 (the light-colored cell). The rest of the cells are false positives. When we are considering label 2, only label 2 is positive and all the other labels are negative. So, in column 2, all the other values are actually negative for label 2 but our model falsely predicted them as label 2.
Precision for label 2: 762 / (762 + 18 + 4 + 16 + 72 + 105 + 9) = 0.77
In the same way, you can calculate precision for each label.
Recall
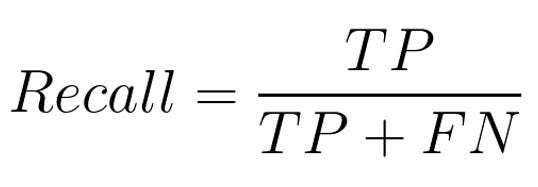
The recall is true positive divided by the true positive and false negative. In other words, recall measures the model’s ability to predict the positives.
Here is the formula:
We will calculate the recall for label 9 and label 2 again. So, the true positives will be the same. But we need to find out the false negatives this time. I suggest trying to think about what might be the false negatives first and then have a look at the explanation here.
Here is the heatmap again:
Look here the red rectangles have a different orientation. Let’s see why.
What is a false negative?
The false negatives are the samples that are actually positives but are predicted as negatives. Let’s consider label 9. As a reminder when we are working on label 9, label 9 is the only positive and the rest of the labels are negatives. Look at the ninth row. All the samples are actually positive there. But 947 samples were predicted as positive. But 14 + 36 + 3 samples are predicted as negatives. These are false negatives for label 9.
Recall for label 9: 947 / (947 + 14 + 36 + 3) = 0.947
In the same way the recall for label 2 is:
762 / (762 + 14 + 2 + 13 + 122 + 75 + 12) = 0.762
You can calculate the recall for each label using this same method.
F1 Score
F1 score is the harmonic mean of precision and recall. Just as a caution, it’s not the arithmetic mean. If precision is 0 and recall is 1, the f1 score will be 0, not 0.5. Here is the formula:
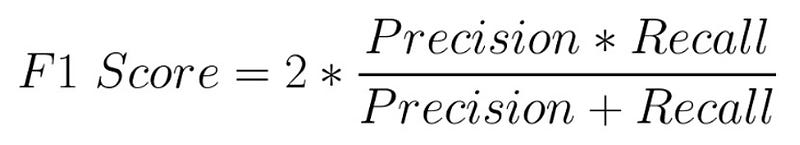
Let’s use the precision and recall for labels 9 and 2 and find out the f1 score using this formula.
F1 score for label 9: 2 * 0.92 * 0.947 / (0.92 + 0.947) = 0.933
F1 score for label 2: 2 * 0.77 * 0.762 / (0.77 + 0.762) = 0.766
I am sure you know how to calculate precision, recall, and f1 score for each label of a multiclass classification problem by now.
But we still want a single-precision, recall, and f1 score for a model. How do we get that?
Macro average and weighted average precision, recall, and F1 score
There are two different methods of getting that single precision, recall, and f1 score for a model.
Let’s start with the precision. We need the precision of all the labels to find out that one single-precision for the model. But we only demonstrated the precision for labels 9 and 2 here. Please feel free to calculate the precision for all the labels using the same method as we demonstrated here.
In the following table, I listed the precision, recall, and f1 score for all the labels.
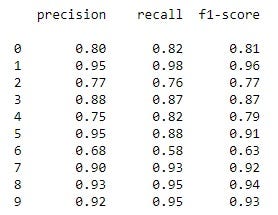
The macro average precision is the simple arithmetic average of the precision of all the labels. So, the macro average precision for this model is:
precision = (0.80 + 0.95 + 0.77 + 0.88 + 0.75 + 0.95 + 0.68 + 0.90 + 0.93 + 0.92) / 10 = 0.853
Please feel free to calculate the macro average recall and macro average f1 score for the model in the same way.
Weighted average precision considers the number of samples of each label as well.
The number of samples of each label in this dataset is as follows:
0 — — 760
1 — — 900
2 — — 535
3 — — 843
4 — — 801
5 — — 779
6 — — 640
7 — — 791
8 — — 921
9 — — 576
The weighted average precision for this model will be the sum of the number of samples multiplied by the precision of individual labels divided by the total number of samples.
The total number of samples will be the sum of all the individual samples:
760 + 900 + 535 + 848 + 801 + 779 + 640 + 791 + 921 + 576 = 7546
To calculate the weighted average precision, we will multiply the precision of each label and multiply them with their sample size and divide it by the total number of samples we just found.
(760*0.80 + 900*0.95 +535*0.77 + 843*0.88 + 801*0.75 + 779*0.95 + 640*0.68 + 791*0.90 + 921*0.93 + 576*0.92) / 7546 = 0.86
As you can see the arithmetic average and the weighted average are a little bit different. If the sample sizes for individual labels are the same the arithmetic average will be exactly the same as the weighted average.
Sklearn Function
The good news is you do not need to actually calculate precision, recall, and f1 score this way. Scikit-learn library has a function ‘classification_report’ that gives you the precision, recall, and f1 score for each label separately and also the accuracy score, that single macro average and weighted average precision, recall, and f1 score for the model. Here is the syntax:
from sklearn import metrics
print(metrics.classification_report(y_test, y_pred))
Here y_test is the original label for the test data and y_pred is the predicted label using the model.
This function also provides you with a column named ‘support’ that is the individual sample size for each label. The support values corresponding to the accuracy, macro avg, and weighted avg are the total sample size of the dataset.
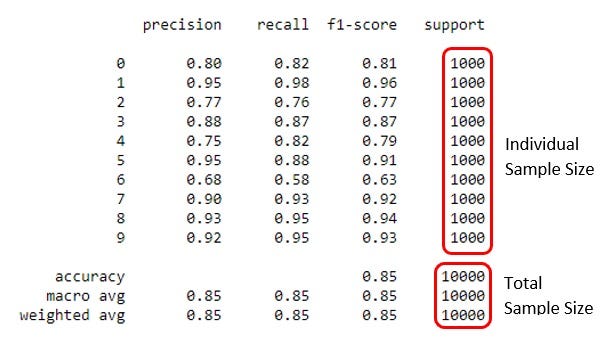
In the picture above, you can see that the support values are all 1000. That means the sample size for all the labels is 1000.
As I mentioned above, if the sample size of each label is the same, the macro average and weighted average will be the same. You can see, in this picture, macro average and weighted averages are all the same.
You will find the complete code of the classification project and how I got the table above in this link:
Conclusion
This article explained how to calculate precision, recall, and f1 score for the individual labels of a multiclass classification and also the single-precision, recall, and f1 score for a multiclass classification model manually from a given confusion matrix. We also talked about how to get them using a single line of code in the scikit-learn library very easily. Hope it was helpful.
Here is the video that explains this same concepts:
Feel free to follow me on Twitter and like my Facebook page.


