
6 Candlestick Patterns you Should Know for Trading
Price action is usually used to predict the future direction the price may take. More specifically, patterns can be seen as an objective interpretation of price action. That’s what makes them reliable.
Today, I’ll cover the most known patterns and try to explain how they can give you plenty of trade opportunities.
How to Read a Japanese Candlestick?
Let’s start with the basics. Patterns are spotted using Japanese candlesticks, so it’s important to know how they are used to display information.
Japanese candlesticks are used to display the “Open”, “High”, “Low”, and “Close” information. Below is a generic candlestick.
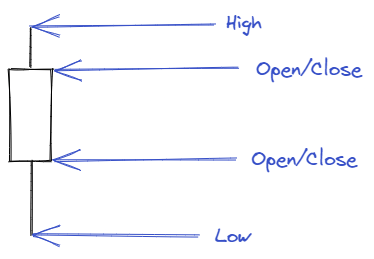
As you can see, there are two possibilities for the “Open” and “Close” information. It’s because it depends on the nature of the candlestick. Either it’s a bullish candlestick or a bearish one.
If the candlestick is bullish, the open price is below the close price. If it’s bearish, the open price is above the close price.
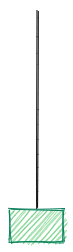
Let’s draw a bullish candlestick:
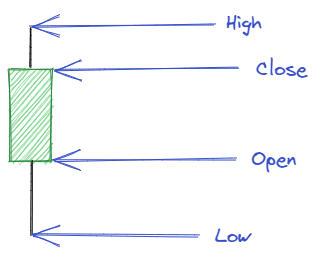
The range from the close to the open is called the “body”. The shadows are the small tails used to represent the high or the low.
Interpret a Japanese Candlestick
As a Japanese candlestick displays several pieces of information, we can assemble them to understand the underlying meaning of the candlestick. Let’s explain it with an example.
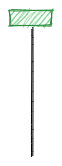
Here, it may look like a strange candlestick. Indeed, it has no upper shadow but a long lower shadow. In addition, it’s a bullish candlestick.
What it means is that there was a strong selling pressure, which pushed the price lower and lower, creating a long lower shadow. Then, buyers regained control and pushed the price back up.
It means the actual consensus is probably bullish. Indeed, you can’t rely only on one candlestick to make a decision, and here comes the next section.
General Advice
In trading, you should never rely on only one thing to make a decision. It applies also to candlestick patterns.
The example above may show a bullish consensus, but you have to confirm this with other things, such as indicators, supports, resistances, Fibonacci retracements, etc…
Simple Candlestick Patterns
To make things easier we’ll begin with simple candlestick patterns. These are patterns composed only of one candlestick. In a next article, I’ll talk about patterns composed of 2 or 3 candlesticks.
Doji
A doji is a candlestick having a really short body. Its body should represent something like 5% of its total range from the high to the low (it’s the threshold I use in algorithmic trading to determine whether a candlestick is or not a doji).
The doji means a lot of uncertainty in the market because neither buyers nor sellers were able to push the price in any particular direction.
If a doji appears during an uptrend, it may mean that the uptrend is exhausting. If it appears during a downtrend, it may mean that the downtrend is exhausting.
There are many types of doji, and they all have the same meaning, which is uncertainty, but a potential price reversal depending on when they occur.
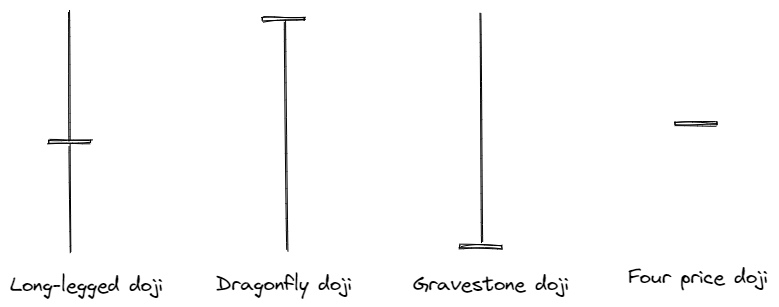
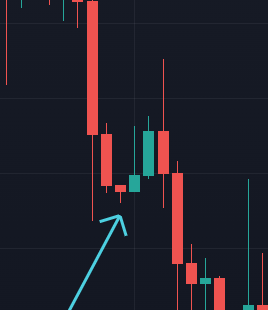
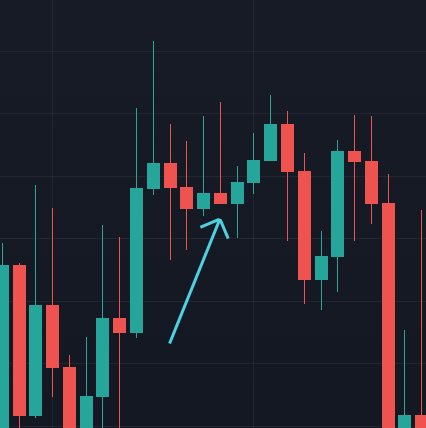
Let’s try to find one in the market now:
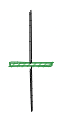
There is a first doji, and a second one later looking like a dragonfly doji.
Marubozu
Marubozu candlesticks have no shadows. Depending on whether the candlestick is bullish or bearish, it means the high and low are the same as the open and close.
It means that the candle opened at its lowest price and closed at its highest price. In other words, it is a strong directional signal, either bullish or bearish.
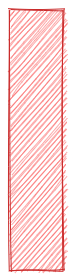
If a bullish marubozu appears during an uptrend, it may be a continuation signal. Else, it may be a reversal signal. And inversely for a bearish marubozu.
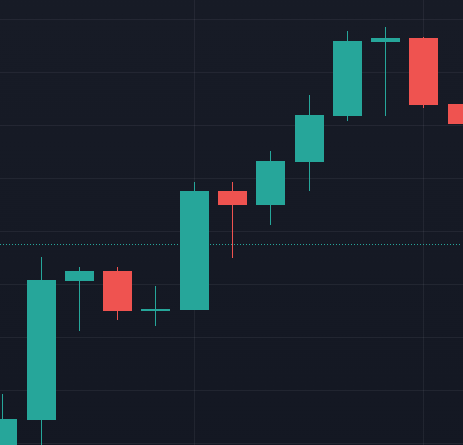
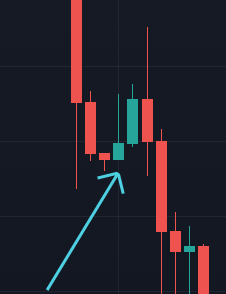
Let’s find one in the market. It’s at the same place as
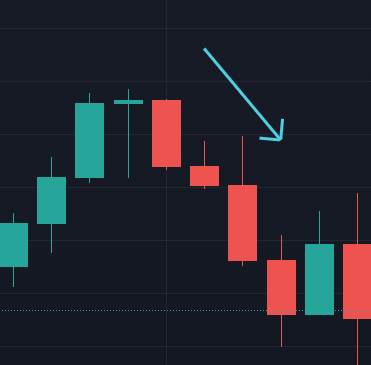
I found it in the same place as the previous example in relation to the doji, so we see the dragonfly doji just before the marubozu.
This is an opportunity for me to show you how to combine patterns. The dragonfly shows some uncertainty after the uptrend, so a potential reversal. This reversal was confirmed by a bearish marubozu just after which is a good bearish signal.
Hammer/Hanging Man
These candlesticks look exactly the same, though they have different meanings.
They have a little body, a long lower shadow, and a very little upper shadow.
What makes them different is that the hammer is formed in a downtrend, while the hanging man is formed in an uptrend.
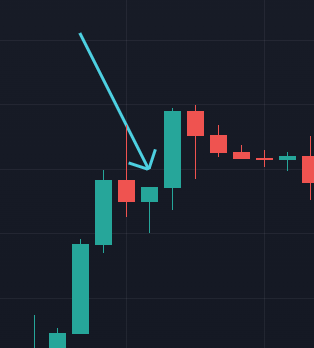
Below is a little hanging man:
And below a little hammer:
As I said earlier, they have different meanings.
For the hammer, the long lower shadow indicates that sellers pushed prices lower, but buyers were able to get the price back near the open, meaning there’s some buying pressure and the downtrend may be exhausting and reverse.
For the hanging man, the long lower shadow shows that sellers pushed prices lower, so the uptrend may be exhausting and reverse.
One thing to know about these patterns is that their color isn’t important. No matter whether they are green or red, they have the same meaning.
Inverted Hammer/Shooting Star
As the hammer and the hanging man, these patterns look the same but are different whether they occur during an uptrend or a downtrend.
They have a little body, a long upper shadow, and a very little lower shadow.
The inverted hammer is formed during a downtrend and the shooting start during an uptrend.
Below is an inverted hammer (you’ll notice it’s the same image as before, the inverted hammer appeared just after the hammer):
And below a shooting star:
The inverted hammer means buyers tried to push the price higher, but sellers managed to avoid it by adding selling pressure. It’s bullish as there are no many sellers to overcome the buying pressure.
The shooting star means that buyers attempted to push the price up, but sellers came in and overpowered them. It’s bearish as there are no many buyers to overcome the selling pressure and push the price higher.
Final Note
Candlestick patterns are a powerful weapon you can add to your trading arsenal, but as I said earlier, they’re not always reliable. You can even see it in the examples, sometimes the situation didn’t happen as expected. It’s completely normal, you have to use other things to confirm the reversals or continuations.
In a next story, I’ll talk about some other patterns composed of many candlesticks. Be sure to follow me if you don’t want to miss this article!
To explore more of my trading stories, click here! You can also access all my content by checking this page.
If you liked the story, don’t forget to clap, comment, and maybe follow me if you want to explore more of my content :)
You can also subscribe to me via email to be notified every time I publish a new story, just click here!
If you’re not subscribed to medium yet and wish to support me or get access to all my stories, you can use my link:
A Message from InsiderFinance

Thanks for being a part of our community! Before you go:
- 👏 Clap for the story and follow the author 👉
- 📰 View more content in the InsiderFinance Wire
- 📚 Take our FREE Masterclass
- 📈 Discover Powerful Trading Tools