
50 must-know terms for UX/UI designers: a comprehensive glossary
Key design notions structured through Design thinking stages
At the beginning of my design journey, I remember being quite overwhelmed by the multitude of notions and concepts.
Google was my best friend for a while.
Today, I decided to put the main concepts in one place, categorizing them by the stages of the typical design thinking process.
What is the Design thinking process?
Simply said, it’s a user-centered problem-solving approach that focuses on empathizing with users, defining their needs, ideating potential solutions, prototyping designs, and testing those solutions with the end users.
The goal is not only to find a solution to the problem but to challenge the problem itself, find the basic issue that needs to be resolved.
By applying the design thinking process, we try to identify and consider the wide range of solutions that might not be immediately apparent.
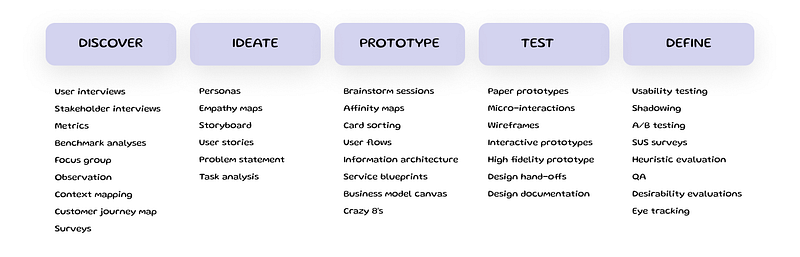
The process can be broken down into 5 main stages:
- Discover: understand the needs and problems of the user.
- Define: clearly articulate the user’s needs and problems based on your findings.
- Ideate: brainstorm and come up with solutions.
- Prototype: build tangible representations of your solutions.
- Test: validate the effectiveness of your prototypes with real users, refining solutions as needed.
These stages are iterative and can be repeated as many times as you need.
Below, I provide short descriptions of the main activities for each stage of Design thinking process, as well as links to the sources where you can read more on the topic.
User interviews
A qualitative research method used to gather insights from potential or existing users about their experiences, needs, pain points, motivations, and challenges about a product, service, or system.
- To read more: Nielsen Norman Group on User interviews.
Stakeholder interviews
A qualitative research method used to gather perspectives, expectations, and concerns from people who have an interest or stake in a project, product, or decision and who may be affected by the outcome or they may influence its direction and success.
The main objectives of stakeholder interviews are to understand the priorities and identify the risks and potential obstacles on the project.
- To read more: Nielsen Norman Group on Stakeholder interviews
Metrics
A quantifiable indicator that tells us about some aspect of the user experience of a product or service. Metrics can help teams assess the design quality and evaluate the improvements over time.
- To read more: Nielsen Norman Group on UX Metrics
Benchmark analyses
An evaluation of a website, application, or product’s usability and overall user experience, often compared to competitors or industry standards.
It is a way to measure the usability of a design in terms of performance metrics (like task completion rate, error rate, satisfaction, etc.) and can be conducted before a redesign to identify problem areas and after to measure the effects of the redesign.
There are two primary types of UX benchmarks:
- Comparative Benchmarking: comparing your product’s usability metrics against competitors.
- Iterative Benchmarking: comparing usability metrics of successive versions of your product over time.
- To read more: Nielsen Norman Group on benchmarks
Focus group
A research method that gathers a group of people to discuss and provide feedback on a product, service, or concept. Focus groups can help to draw insights from group dynamics and discussions.
- To read more: Scribbr on Focus Groups
Observation
A research method in which designers watch and analyze users as they interact with a product, system, or service in their natural environment or a controlled setting.
The primary goal is to gain a deeper understanding of user interactions, identify usability issues, and discern the unspoken needs and pain points that users might not be able to articulate directly.
This technique often helps to notice the patterns, hesitations, and any emotional reactions and to ensure that the design is aligned with user expectations.
- To read more: Interaction Design Foundation on Observations
Context mapping
A tool used to visualize and understand the various factors that influence a user’s behavior and decisions. It considers the broader context, like social, technological, and economic factors, in which users interact with a product or service.
- To read more: The best article on the topic
Customer journey map
A visual representation of a customer’s interactions and experiences with a product or service over time. It captures touchpoints, emotions, pain points and highlights opportunities for improvement.
- To read more: Nielsen Norman Group on Customer Journey Mapping
Surveys
A research method used to collect quantitative and sometimes qualitative data from a large group of users by asking a set of predefined questions.
While they may not provide in-depth insights of other UX methods, such as user interviews or usability tests, surveys can quickly gather feedback from a broad audience, offering a holistic view of user perceptions.
- To read more: Nielson Norman Group on surveys
Personas
Fictional representations of the different user types that might use a site, brand, or product in a similar way. They describe real users’ patterns, behaviors, pain points, and goals.
Detailed profiles of typical users of the product that include demographics, behavior patterns, motivations, goals, and pain points. Persona act as a reference point to make sure that design solutions meet the needs and expectation of the target audience.
- To read more: UX Desing institute on Personas
Empathy maps
A tool that visualizes feelings, thoughts, needs, and behaviors of a user, typically divided into sections such as ‘Think’, ‘Feel’, ‘Say’, and ‘Do’. It aids designers in understanding the user’s perspectives and identifying common themes that may not be immediately seen.
- To read more: Interaction Design Foundation on Empathy Maps
Storyboard
A visual representation, often in the form of a sequence of illustrations or images, showing the flow of user interactions with a product or service. Storyboard visualizes and communicates user experiences, particularly in the context of a user’s journey.
- To read more: NN Group on Storyboarding
User stories
A concise, informal description of one or more aspects of a software system from an end-user perspective. They typically focus on what the user needs to do and why, often formatted as: “As a [type of user], I want [an action] so that [a benefit/a value]”.
- To read more: Mountain Goat Software on User Stories
Problem statement
A clear, concise description of the challenges that need to be addressed. In UX, it focuses on user issues and challenges, providing a focused objective for design solutions.
- To read more: NN Group on Problem statement
Task analysis
A method used to understand and optimize user tasks. By breaking down activities into smaller steps, it provides insights into how users interact with a system or product.
The process includes:
- Task identification: list the main tasks users perform.
- Decomposition: breaking down tasks into individual steps.
- Requirements: listing tools or knowledge needed for each step.
- Interdependencies: understanding how tasks relate to one another.
- Pain points: recognizing challenges that users may face during tasks accomplishion
- To read more NN Group on Task Analysis
Brainstorm sessions
A collaborative approach to generate creative ideas and solutions. During these sessions, participants are encouraged to freely share thoughts without immediate judgment.
To read more: Interaction design on Brainstorming
Affinity maps
A tool to organize insights from research or brainstorming sessions. Ideas or insights are written on cards (or sticky notes) and grouped based on their natural relationships.
To read more: Interaction Design Foundation on Affinity Diagrams
Card sorting
A user-centered technique for organizing and categorizing website content, typically used to evaluate the information architecture of a site. Participants sort topic cards into categories that make sense to them.
- To read more: Nielsen Norman Group on Card Sorting
User flow
A visual representation of the set of interactions that describe the typical combination of steps a user takes to accomplish a common task performed with a product.
Compared to the user journey, user flow shows the part of the process in a more granular way and focuses on a specific objective.
- To read more: Career Foundry on User Flow
Information Architecture (IA)
The process of structuring and organization of information to make the content accessible and understandable. Information architecture focuses on arranging, labeling, and connecting content in a manner that aligns with users’ expectations and cognitive processes.
Service blueprint
A visualization of how a service process works, considering the interactions between the user, service touchpoints, and the service provider. It reveals the “behind the scenes” activities to deliver a service experience.
- To read more: Nielsen Norman Group on Service Blueprints
Business model canvas
A strategic management template for developing new or documenting existing business models. It visualizes a business’s value proposition, infrastructure, customers, and finances in a single canvas.
- To read more: Strategyzer on Business Model Canvas
Crazy 8s
A rapid sketching exercise that challenges participants to sketch eight distinct ideas in eight minutes. It’s used to encourage diverse thinking and come up with a broad range of ideas quickly.
- To read more: Design Sprint Kit on Crazy 8s
Paper prototypes
The hand-drawn representations of user interfaces created with simple materials like paper and pen. A paper prototype provides the first depiction of design concepts, allowing the designer to validate and refine the ideas in the initial stages of design.
- To read more: N/N Group on Paper prototyping
Microinteractions
Small, subtle, single-task interactions in the user interface that enhance the user experience, such as the feedback you get from a button or the way an item is saved.
- To read more: N/N group on Microinteractions
Wireframes
A static visual representation of the design, often used to showcase the visual look and feel of a product without any interactivity. Mockups provide stakeholders with a clear picture of the design’s aesthetic aspects, including color schemes, typography, and layout.
- To read more: N/N Group on Wireframes
Interactive Prototypes
These are clickable models of a product that simulate user interactions, offering stakeholders and testers a tangible experience of the final product’s functionality.
Unlike static mockups, interactive prototypes allow users to explore features, transitions, and interactions, serving as a tool for usability testing and feedback collection.
- To read more: Adobe Blog on Interactive Prototyping
High-fidelity prototypes
A detailed and polished representation of the final product design. High-fidelity prototypes include precise visuals, interactions, and transitions, offering a near-accurate depiction of a product’s look and feel.
- To read more: NN Group on High-Fidelity Design
Design handoffs
The process where designers transition a project to developers, ensuring that the latter has all the necessary information to build the product.
It typically involves transferring designs, assets, and documentation that specify design details, behaviors, and interactions.
Effective design handoffs minimize confusion, reducing back-and-forths between design and development teams.
- To read more: Interaction Design Foundation on Design Handoff
Design documentation
A comprehensive guide created by designers that details the design decisions and provides a roadmap for stakeholders, especially developers, to understand and implement the design.
Documentation can include user flows, wireframes, mockups, interactive prototypes, design principles, and guidelines.
The goal is to ensure that everyone involved understands the design’s intent, functionality, and structure.
- To read more: N/N group on Design documentation

Usability testing
An observational method where potential users complete tasks on a product or interface. This identifies problems and gathers insights directly from the user.
- To read more: N/N Group on Usability testing
Shadowing
A research technique where observers watch and follow users in their natural environment, aiming to gather contextual insights on user behavior and challenges.
- To read more: Interaction Design Foundation on Shadowing
A/B Testing
A method where two versions of a webpage or product feature are compared to see which one performs better in terms of user engagement, conversions, or other metrics.
- To read more: Optimizely’s Guide on A/B Testing
SUS survey (System Usability Scale)
A widely used questionnaire that helps measure the perceived usability of a product or service.
The SUS consists of a 10-item scale with five response options, ranging from “Strongly agree” to “Strongly disagree”.
While it doesn’t give specific feedback on particular aspects of a design, it offers a broad assessment of overall usability.
- To read more: N/N Group on System Usability Scale
Heuristic evaluation
An expert-driven usability evaluation method where a product or service is assessed against a set of established usability principles (heuristics).
Experts review the interface and identify usability issues based on these heuristic principles, making it a cost-effective way to find and rectify usability problems early in the design process.
- To read more: Nielsen Norman Group on Heuristic Evaluation
QA (Quality Assurance)
A systematic process that ensures a product or service meets specified requirements and standards. QA involves systematic testing of software applications to identify bugs, glitches, or other inconsistencies, ensuring that the final product delivers a seamless user experience.
- To read more: N/N on QA and its impact on UX
Desirability evaluations
A method used to gather users’ emotional reactions to a product or interface.
Participants are often provided with a set of adjectives (e.g., “innovative,” “boring,” “friendly”) and asked to select those that best describe their feelings about the design.
This helps designers understand the intangible aspects of user experience.
- To read more: N/N Group on Desirability
Eye tracking
A research method that uses technology to measure where participants look (fixations), the sequence of their gaze (saccades), and the duration of their gaze.
Eye tracking can reveal how users visually interact with a user interface, identify areas of interest or confusion, and help optimize design elements like layout, imagery, and call-to-action buttons.
- To read more: Nielsen Norman Group on Eye Tracking
If you liked this article, please follow my profile so you don’t miss any upcoming articles!
🙋♀️ Have any questions or inquiries? Reach out to me at Linkedin & DM me


