
50 Mathematical Concepts For Better Programming (Part 2)
If you are someone new to Python or programming overall, check out my new book called ‘The No Bulls**t Guide To Learning Python’ below:
Check out the previous part of this series below:
6. Correlation
A term introduced by Francis Galton, Correlation is a property that demonstrates how two variables are associated with each other.
It determines how varying one variable changes the other.
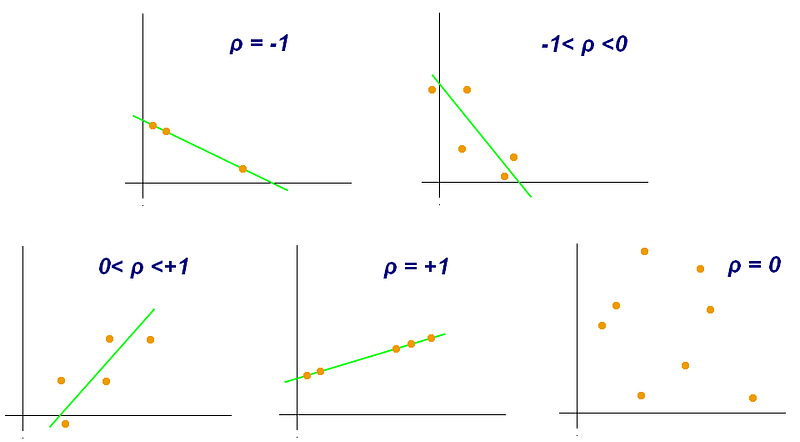
The Pearson correlation coefficient / Pearson’s r (ρ) measures this correlation on a scale from -1 to 1 where:
- 0 — No correlation
- -1 — Anti-correlation
- 1 — Perfect correlation
Remember that:
Correlation does not imply causation.
The number of ice creams sold on a particular day and the number of children born on that day may correlate but this does not mean that one is the cause of another.
7. Regression
It is a process of mathematically estimating the relationships between a dependent variable and one or more independent variables.
Two types of regression models are explained below.
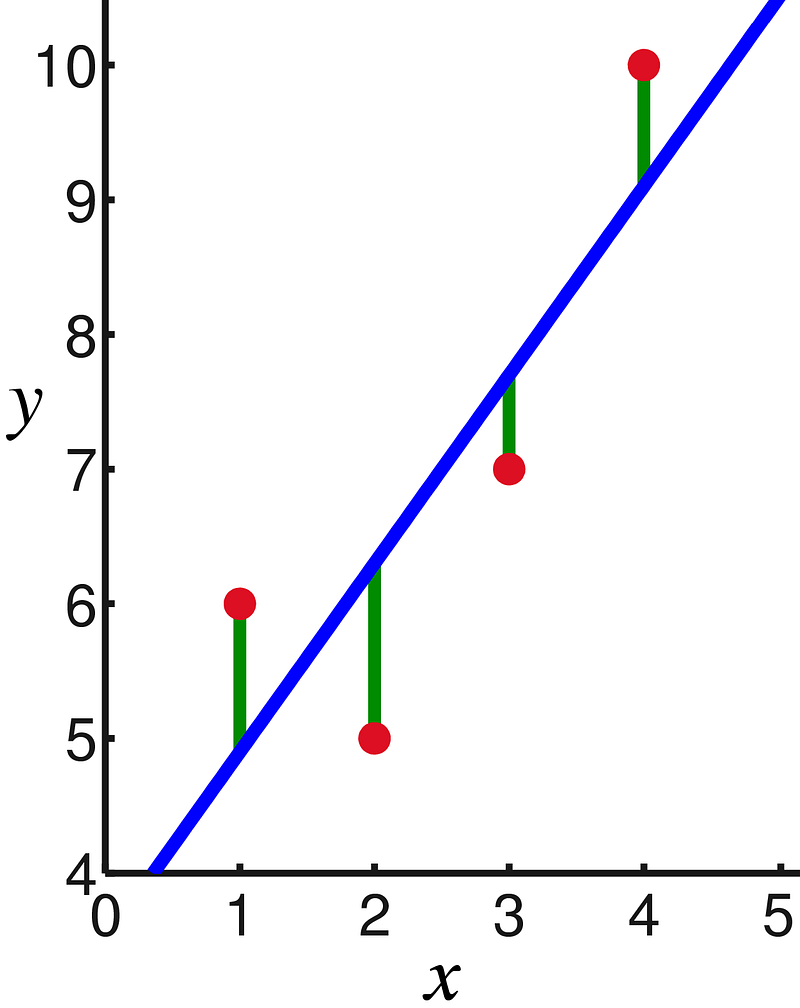
8. Linear Regression
It is an approach to modeling the linear relationship between different variables.
This relation can be between:
- two variables (plotted on a 2-D plane) or
- multiple variables (plotted on a multi-dimensional plane)
The relation between two variables can be represented as:
y = m*x + c
where x is the independent variable and y is the dependent variable.
The line that minimizes the sum of the squared vertical distance between the data points is considered the best-fitting line for linear regression.
Linear regression as a machine learning model can be used to predict continuous variables as opposed to classification.
For example, estimating the temperature (a continuous variable) at a particular time of the day.
Coefficient Of Determination (R²)
It is the proportion of the variation in the dependent variable that is predictable from the independent variable.
R² is calculated as follows where:
- SS(res) is the sum of squares of residuals (the sum of squared distance between the line of best fit and observations)
- SS(tot) is the total sum of squares (the sum over all squared differences between the observations and their overall mean)
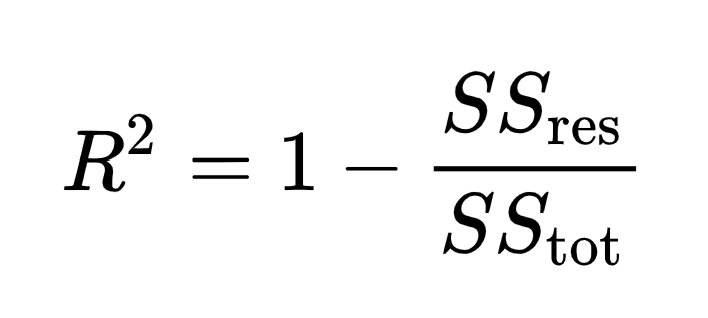
Note that R² should not be confused with the square of Pearson’s coefficient.
R² is used to measure how well the predicted values match the observed values than mere correlation as done by Pearson’s coefficient.
To learn more, check out this great article by Krishna Rao:
R² can range between any negative number to +1, where
- +1 indicates a perfect match of observations to predictions
- 0 indicates that predictions are random
- a negative number indicates that the predictions are worse than random
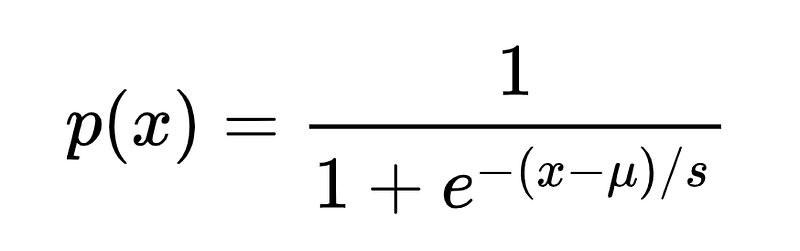
9. Logistic Regression
This approach estimates the probability of an event occurring (that lies between 0 and 1) based on given independent variables.
Logistic Regression as a machine learning model is used for classification tasks (as opposed to regression tasks).
These classification tasks can either be:
- binary (classification between 2 outcomes)
- multi-class (classification between more than 2 outcomes)
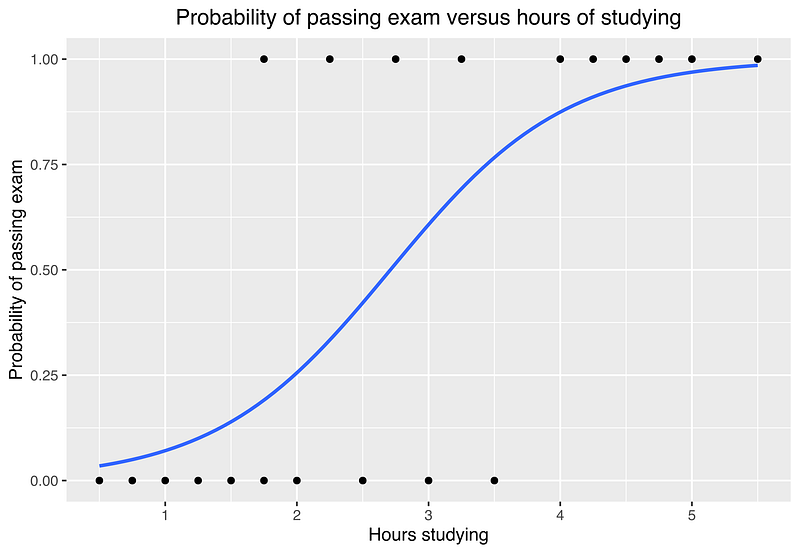
The Logistic function is written as follows where :
- μ is a location parameter or the midpoint of the logistic curve (0.5 in the plot below)
- s is a scale parameter
The following logistic plot is used to classify the probability of passing the exam based on the number of hours of study.
Check out the other parts of the series below:
Thanks for reading this article!
If you are someone new to Python or programming overall, check out my new book called ‘The No Bulls**t Guide To Learning Python’ below: