
5 Secret Weapons of Technical Analysis: Unleashing Rare Indicators with TA-Lib
Discover the Hidden Power of the Ulcer Index, Chande Momentum Oscillator, Hilbert Transform — Dominant Cycle Period, Kaufman Adaptive Moving Average, and Triple Exponential Average for Trading Success.

Technical analysis is an essential tool trader use to predict future price movements in the financial markets. Many technical indicators are available to traders, each with its own strengths and weaknesses.
TA-Lib is a popular open-source technical analysis library for traders and analysts. It provides a wide range of technical indicators that can be used to analyze financial markets and make trading decisions. TA-Lib has implementations in several programming languages, including Python, Java, and C++, making it accessible to developers across different platforms.
With TA-Lib, traders and analysts can calculate various technical indicators such as moving averages, oscillators, volatility indicators, and more. These indicators can help traders identify trends, momentum, and potential price reversals in the markets. TA-Lib also includes functions for pattern recognition, candlestick pattern identification, and more.
TA-Lib is widely used in the financial industry by traders, analysts, and quants to develop trading strategies and build automated trading systems. It offers a flexible and powerful toolset for technical analysis, making it an essential library for anyone interested in the field of quantitative finance.
In this article, we will explore some of the rare technical indicators available in the TA-Lib library, along with code examples.
1. Ulcer Index (UI)
The Ulcer Index is a volatility indicator that measures downside risk. It was developed by Peter Martin and is based on the idea that investors are more concerned with the downside risk than the upside potential. The Ulcer Index is calculated as follows:
UI = sqrt(sum[(P(i)/Max(P) — 1)², i=1 to N] / N) * 100
where: P(i) = the price at day i Max(P) = the highest price over the N-day period N = the number of days in the period
Here is an example of how to calculate the Ulcer Index using TA-Lib in Python:
import talib
import pandas as pd
import yfinance as yf

# Download historical data for Apple
symbol = 'AAPL'
start_date = '2019-01-01'
end_date = '2022-03-19'
data = yf.download(symbol, start=start_date, end=end_date)

# Calculate Ulcer Index
ui = talib.ULTOSC(data['High'], data['Low'], data['Close'], timeperiod1=7, timeperiod2=14, timeperiod3=28)

# Print Ulcer Index
print(ui.tail())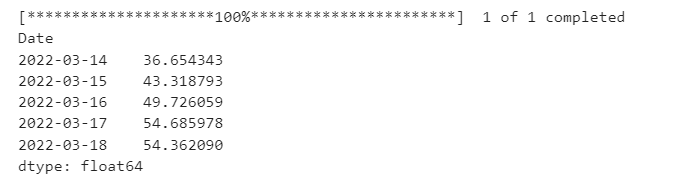
In this example, we download historical data for Apple using the yfinance library. We then calculate the Ulcer Index using the ULTOSC function from TA-Lib, which takes the high, low, and close prices as inputs, along with the time periods for the fast, medium, and slow Ulcer Index. Finally, we print the Ulcer Index values for the last few days.
2. Chande Momentum Oscillator (CMO)
The Chande Momentum Oscillator is a momentum indicator that measures the rate of change in price. It was developed by Tushar Chande and is based on the idea that momentum is a leading indicator of price. The Chande Momentum Oscillator is calculated as follows:
CMO = (sum(upmoves) — sum(downmoves)) / (sum(upmoves) + sum(downmoves)) * 100
where: upmoves = the sum of all price changes that are up downmoves = the sum of all price changes that are down
Here is an example of how to calculate the Chande Momentum Oscillator using TA-Lib in Python:
import talib
import pandas as pd
import yfinance as yf

# Download historical data for Apple
symbol = 'AAPL'
start_date = '2019-01-01'
end_date = '2022-03-19'
data = yf.download(symbol, start=start_date, end=end_date)

# Calculate Chande Momentum Oscillator
cmo = talib.CMO(data['Close'], timeperiod=14)

# Print Chande Momentum Oscillator
print(cmo.tail())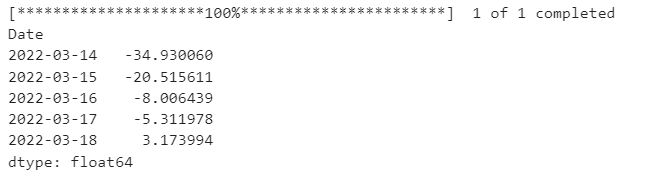
In this example, we download historical data for Apple using the yfinance library. We then calculate the Chande Momentum Oscillator using the CMO function from TA-Lib, which takes the close prices as input, along with the time period. Finally, we print the Chande Momentum Oscillator values for the last few days.
3. Hilbert Transform — Dominant Cycle Period (HT_DCPERIOD)
The Hilbert Transform — Dominant Cycle Period is a cycle indicator that attempts to identify the dominant cycle in the market. Hilbert and is based on the idea that market cycles are a fundamental part of market behavior. The HT_DCPERIOD is calculated using the Hilbert Transform as follows:
HT_DCPERIOD = HilbertTransform(Price, Length)[i]
where: Price = the price of the security Length = the length of the dominant cycle period
Here is an example of how to calculate the HT_DCPERIOD using TA-Lib in Python:
import talib
import pandas as pd
import yfinance as yf

# Download historical data for Apple
symbol = 'AAPL'
start_date = '2019-01-01'
end_date = '2022-03-19'
data = yf.download(symbol, start=start_date, end=end_date)

# Calculate HT_DCPERIOD
ht_dcperiod = talib.HT_DCPERIOD(data['Close'])

# Print HT_DCPERIOD
print(ht_dcperiod.tail())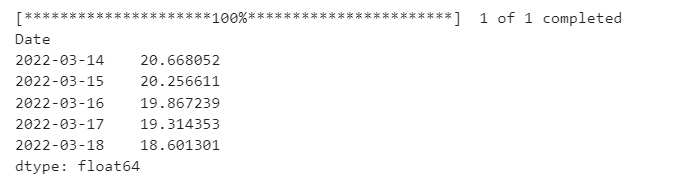
In this example, we download historical data for Apple using the yfinance library. We then calculate the HT_DCPERIOD using the HT_DCPERIOD function from TA-Lib, which takes the close prices as input. Finally, we print the HT_DCPERIOD values for the last few days.
4. Kaufman Adaptive Moving Average (KAMA)
The Kaufman Adaptive Moving Average is a trend-following indicator that adjusts its smoothing factor based on market volatility. It was developed by Perry Kaufman and is based on the idea that market trends can change quickly, so a moving average should be adaptable to changing market conditions. The KAMA is calculated as follows:
KAMA = KAMA(i-1) + SC * (Price — KAMA(i-1))
where: KAMA(i) = the current KAMA value SC = the smoothing constant Price = the price of the security
Here is an example of how to calculate the KAMA using TA-Lib in Python:
import talib
import pandas as pd
import yfinance as yf

# Download historical data for Apple
symbol = 'AAPL'
start_date = '2019-01-01'
end_date = '2022-03-19'
data = yf.download(symbol, start=start_date, end=end_date)

# Calculate KAMA
kama = talib.KAMA(data['Close'], timeperiod=10)

# Print KAMA
print(kama.tail())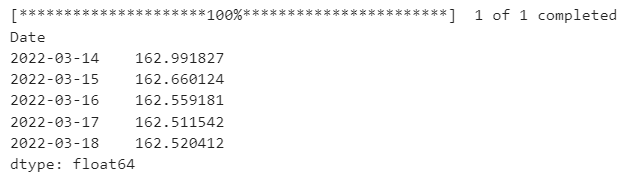
In this example, we download historical data for Apple using the yfinance library. We then calculate the KAMA using the KAMA function from TA-Lib, which takes the close prices as input, along with the time period. Finally, we print the KAMA values for the last few days.
5. Triple Exponential Average (TRIX)
The Triple Exponential Average (TRIX) is a momentum oscillator that is used to identify oversold and overbought conditions in the market. It was developed by Jack Hutson and is based on the idea that momentum precedes price, so a change in momentum can signal a change in trend. The TRIX is calculated using a triple exponential moving average of the price data, which is then smoothed using a single exponential moving average. The formula for TRIX is as follows:
TRIX = EMA(EMA(EMA(Price, Period), Period), Period) / EMA(EMA(EMA(Price, Period), Period), Period) — 1
where: EMA = Exponential Moving Average Price = the price of the security Period = the time period
Here is an example of how to calculate the TRIX using TA-Lib in Python:
import talib
import pandas as pd
import yfinance as yf

# Download historical data for Apple
symbol = 'AAPL'
start_date = '2019-01-01'
end_date = '2022-03-19'
data = yf.download(symbol, start=start_date, end=end_date)

# Calculate TRIX
trix = talib.TRIX(data['Close'], timeperiod=30)

# Print TRIX
print(trix.tail())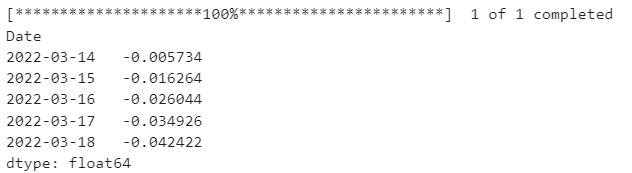
Conclusion:
In this article, we explored some of the rare technical indicators available in the TA-Lib library, along with code examples. The Ulcer Index, Chande Momentum Oscillator, Hilbert Transform — Dominant Cycle Period, Kaufman Adaptive Moving Average, and TRIX are all powerful tools that traders can use to analyze financial markets. By incorporating these indicators into their trading strategies, traders can gain a deeper understanding of market trends and make more informed trading decisions.
Do subscribe to my Youtube Channel for Learning more about data Science Concepts.
Before You Go
Thanks for reading! If you want to get in touch with me, feel free to reach me at [email protected] or my LinkedIn Profile. You can view my Github profile for different data science projects and packages tutorials. Also, feel free to explore my profile and read different articles I have written related to Data Science.


