
5 Powerful Techniques to Let You Debug Like a Pro
On how to bite the debugging bullet

As a developer, it is hard enough to explain your job to stranger at parties. So when asked about our profession, we often mention a shiny feature we recently build or a new technique we are experimenting with. Rarely do we mention the most tedious and frustrating — but equally important — part of our job: debugging.
Human errors are a given. And since code is — at least for know — written by humans, solving those errors is an integral part of our job. Because debugging is perceived as a necessary evil, it is often done rashly and without much thought. But, when you master the tools to do the job, debugging can actually be fun and rewarding.
Solving problems in structured and effective ways can be just as valuable as developing new functionality. So to let you boast about your debugging skills at your next birthday party, here are 5 techniques to help you solve bugs like a pro.
1. Use the "debugger" statement
All modern browsers contain high-quality debugging tools. So if you run into a client-side bug, placing breakpoints inside to browser’s debugger is generally a good idea.
But finding the correct file and line number inside the debugger can be tedious. Behold the debugger statement! This statement will act as a breakpoint in the debugging tool available, so you can directly start debugging at the right place.
function potentiallyBuggyCode() {
    debugger;
    // do potentially buggy stuff to examine, step through, etc.
}
2. Inspect the stack trace
Errors are often the tip of the iceberg. A pathway of code that led to the error is hidden beneath the surface. Therefore an error is often hard to understand in isolation. The error’s stack reveals the pathway of function calls that ultimately resulted in the error. The file names and line numbers of the subsequent calls are exposed, helping you to understand the error better.
The snippet below is a trace of 3 functions: trace , b and a . The error originated by subsequently calling function a on line 19, b on line 16, and finally trace on line 17. Seeing the actual code path, makes debugging way easier.
trace@file:///C:/example.html:9:17
b@file:///C:/example.html:16:13
a@file:///C:/example.html:19:13
@file:///C:/example.html:21:9
stack is property of Javascript runtime Error object, meaning it can simply be accessed using error.stack . Most debugging tools do this for you, exposing the stack directly.
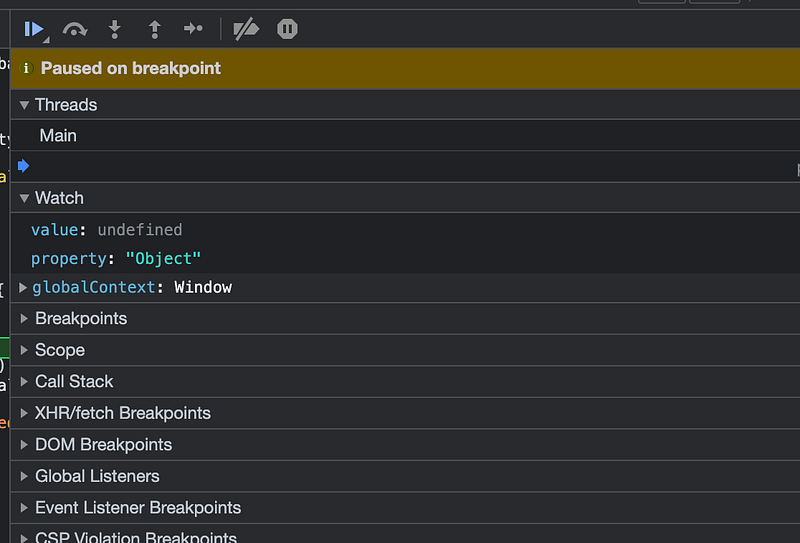
3. Watch variables
A lot of times bugs can be found by variables with unexpected values. However, those values may change over time. Watch makes tracking the current value of a variable dead simple: simply add the variable(s) you are interested into the “watch” section of your debugging tools. Whenever a value of a watched variable changes, the new value will be highlighted.
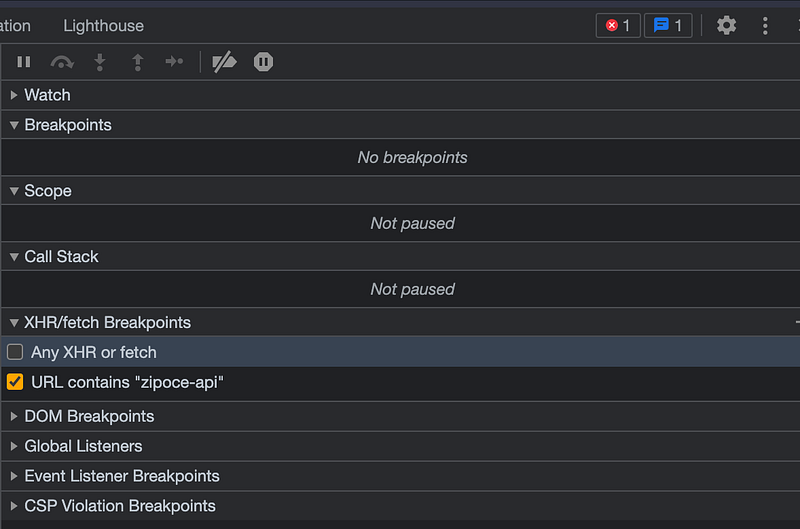
4. Watch external request
Modern applications — all the more since the rise of the Jamstack — are packed with HTTP requests. To simplify the debugging of external requests, you can use the XHR/Fetch section of the debugging tools. You can either set a breakpoint on all request or filter based upon text snippets in the target url. So in the example below, a breakpoint is activated when a request to a target containing “zipcode-api” is made — e.g. https://www.zipcode-api.com.
5. Use a debugger within your IDE
While bugs originate in the source code, their result often becomes apparent in end products like websites and mobile apps. That is why solving a bug often involves frantically toggling between source code and the browser.
To eliminate this distraction, you could use a built-in debugger of your IDE. The most popular IDE out there, Visual Studio Code, has built-in debuggers for Chrome, Edge, and Node.js. These build in debuggers add all-important debugging functionality, like breakpoints, a stack trace, and watching variables, to your IDE. You will never have to switch screens again.
That’s it: 5 powerful techniques to support your debugging. I hope you learned something along the way. Interested in more things Javascript, check out the article below: