
Data Science
5 Pandas Group By Tricks You Should Know in Python
All you need to know about Pandas DataFrame Group By to use it efficiently

Pandas Power! 🔋
Pandas is widely used Python library for data analytics projects. However, it is never easy to analyze the data as it is to get valuable insights from it. To understand the data better, you need to transform and aggregate it. And that’s when groupby comes into the picture.
In Pandas, groupby essentially splits all the records from your dataset into different categories or groups and offers you flexibility to analyze the data by these groups.
It is extremely efficient and must know function in data analysis, which gives you interesting insights within few seconds. And that’s why it is usually asked in data science job interviews. Therefore, it is important to master it. 💯
In this article, I am explaining 5 easy pandas groupby tricks with examples, which you must know to perform data analysis efficiently and also to ace an data science interview.
Although the article is short, you are free to navigate to your favorite part with this index and download entire notebook with examples in the end!
  ∘ How exactly group by works on pandas DataFrame?
· Number of Groups
· Group Sizes
· Get First and Last
· Get Groups
· Aggregate Multiple Columns with Different Aggregate Functions
📍 Note: I’m using a self created Dummy Sales Data which you can get on my Github repo for Free under MIT License!!
Let’s import the dataset into pandas DataFrame — df
import pandas as pd
df = pd.read_csv("Dummy_Sales_Data_v1.csv")
df.head()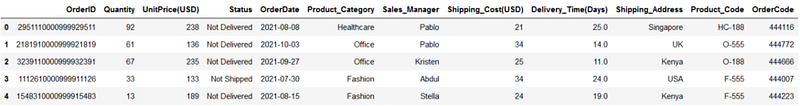
It is a simple 9999 x 12 Dataset which I created using Faker in Python 📚
Before going further, let’s quickly understand —
How exactly group by works on pandas DataFrame?
When you use .groupby() function on any categorical column of DataFrame, it returns a GroupBy object. Then you can use different methods on this object and even aggregate other columns to get the summary view of the dataset.
For example, you used .groupby() function on column Product Category in df as below to get GroupBy object.
df_group = df.groupby("Product_Category")
type(df_group)
# Output
pandas.core.groupby.generic.DataFrameGroupByThe returned GroupBy object is nothing but a dictionary where keys are the unique groups in which records are split and values are the columns of each group which are not mentioned in groupby.
Certainly, GroupBy object holds contents of entire DataFrame but in more structured form. And just like dictionaries there are several methods to get the required data efficiently. ✅
Let’s start with the simple thing first and see in how many different groups your data is spitted now.
Number of Groups
Once you split the data into different categories, it is interesting to know in how many different groups your data is now divided into.
The simple and common answer is to use the nunique() function on any column, which essentially gives you number of unique values in that column. So, as many unique values are there in column, those many groups the data will be divided into.
For example, You can look at how many unique groups can be formed using product category.
df.Product_Category.nunique()-- Output
5However, when you already have a GroupBy object, you can directly use its
method ngroups which gives you the answer you are looking for. Here is how you can use it.
df_group = df.groupby("Product_Category")
df_group.ngroups
-- Output
5Once you get the number of groups, you are still unware about the size of each group. The next method gives you idea about how large or small each group is.
Group Sizes
Number of rows in each group of GroupBy object can be easily obtained using function .size().
For an instance, you want to see how many different rows are available in each group of product category. This can be simply obtained as below —
df.groupby("Product_Category").size()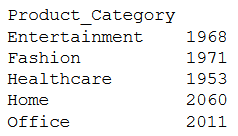
It simply counts the number of rows in each group. Here one can argue that, the same results can be obtained using an aggregate function count(). Let’s give it a try,
df.groupby("Product_Category").count()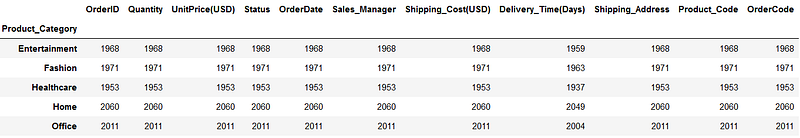
You can see the similarities between both results — the numbers are same. However there is significant difference in the way they are calculated.
As per pandas, the aggregate function .count() counts only the non-null values from each column, whereas .size() simply returns the number of rows available in each group irrespective of presence or absence of values.
Therefore, you must have strong understanding of difference between these two functions before using them. In simple words, you want to see how many non-null values present in each column of each group, use .count(), otherwise, go for .size() ✅
Once you get the size of each group, you might want to take a look at first, last or record at any random position in the data. The next method can be handy in that case.
Get First and Last
These functions return the first and last records after data is split into different groups. Rather than referencing to index, it simply gives out the first or last row appearing in all the groups.
For an instance, you can see the first record of in each group as below,
df.groupby("Product_Category").first()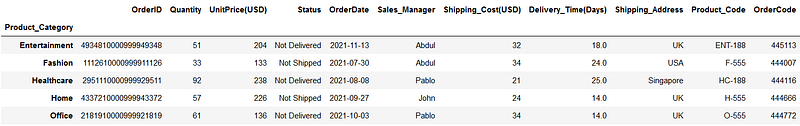
Exactly, in the similar way, you can have a look at the last row in each group.
df.groupby("Product_Category").last()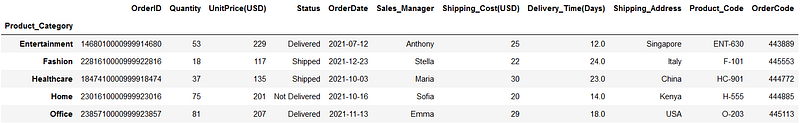
It simply returned the first and the last row once all the rows were grouped under each product category.
Further, you can extract row at any other position as well. For example, extracting 4th row in each group is also possible using function — .nth()
df.groupby("Product_Category").nth(3)Remember, indexing in Python starts with zero, therefore when you say .nth(3) you are actually accessing 4th row.
Logically, you can even get the first and last row using .nth() function. For example you can get first row in each group using .nth(0) and .first() or last row using .nth(-1) and .last().
Then Why does these different functions even exists?? 🚩
Although .first() and .nth(0) can be used to get the first row, there is difference in handling NaN or missing values. .first() give you first non-null values in each column, whereas .nth(0) returns the first row of the group, no matter what the values are. Same is the case with .last()
Therefore, I recommend using .nth() over other two functions to get required row from a group, unless you are specifically looking for non-null records. 💯
But suppose, instead of retrieving only a first or a last row from the group, you might be curious to know the contents of specific group. The next method quickly gives you that info.
Get Groups
The pandas GroupBy method get_group() is used to select or extract only one group from the GroupBy object.
For example, suppose you want to see the contents of ‘Healthcare’ group. This can be done in the simplest way as below.
df_group.get_group('Healthcare')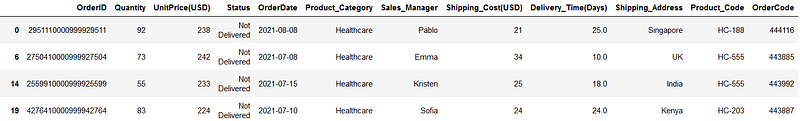
As you see, there is no change in the structure of the dataset and still you get all the records where product category is ‘Healthcare’.
I have an interesting use-case for this method — Slicing a DataFrame
Suppose, you want to select all the rows where Product Category is ‘Home’. A simple and widely used method is to use bracket notation [ ] like below,
df[df["Product_Category"]=='Home']And nothing wrong in that. But you can get exactly same results with the method .get_group() as below,
df_group = df.groupby("Product_Category")
df_group.get_group('Home')
A step further, when you compare the performance between these two methods and run them 1000 times each, certainly .get_group() is time-efficient. ✅
Slicing with .groupby() is 4X faster than with logical comparison!!
This was about getting only the single group at a time by specifying group name in the .get_group() method. But, what if you want to have a look into contents of all groups in a go??
Do you remember —
GroupByobject is a dictionary!! 🚩
So, you can literally iterate through it as you can do it with dictionary — using key and value arguments. 💯
Here is how you can take a sneak-peek into contents of each group.
for name_of_group, contents_of_group in df_group:
    print(name_of_group)
    print(contents_of_group)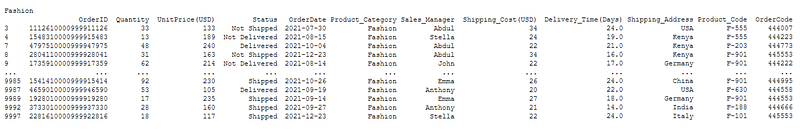
It will list out the name and contents of each group as shown above. Contents of only one group are visible in the picture, but in the Jupyter-Notebook you can see same pattern for all the groups listed one below another.
It basically shows you first and last five rows in each group just like .head() and .tail() methods of pandas DataFrame.
Next, the use of pandas groupby is incomplete if you don’t aggregate the data. Let’s explore how you can use different aggregate functions on different columns in this last part.
Aggregate Multiple Columns with Different Aggregate Functions
Applying a aggregate function on columns in each group is one of the widely used practice to get summary structure for further statistical analysis.
As per IBM,
You can analyze the aggregated data to gain insights about particular resources or resource groups
And that is where pandas groupby with aggregate functions is very useful. With groupby, you can split a data set into groups based on single column or multiple columns. And then apply aggregate functions on remaining numerical columns.
Let’s continue with the same example. After grouping the data by Product category, suppose you want to see what is the average unit price and quantity in each product category.
All you need to do is refer only these columns in GroupBy object using square brackets and apply aggregate function .mean() on them, as shown below —
#Create a groupby object
df_group = df.groupby("Product_Category")
#Select only required columns
df_columns = df_group[["UnitPrice(USD)","Quantity"]]#Apply aggregate function
df_columns.mean()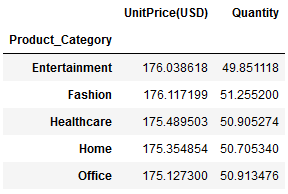
In this way you can get the average unit price and quantity in each group. You can add more columns as per your requirement and apply other aggregate functions such as .min(), .max(), .count(), .median(), .std() and so on.
🚩 Please note that, the code is split into 3 lines just for your understanding, in any case the same output can be achieved in just one line of code as below.
df.groupby("Product_Category")[["UnitPrice(USD)","Quantity"]].mean()Although it looks easy and fancy to write one-liner like above, you should always keep in mind the PEP-8 guidelines about number of characters in one line. You can read more about it in below article.
Moving ahead, you can apply multiple aggregate functions on the same column using the GroupBy method .aggregate(). Simply provide the list of function names which you want to apply on a column.
For an instance, suppose you want to get maximum, minimum, addition and average of Quantity in each product category. So the aggregate functions would be min, max, sum and mean & you can apply them like this.
df.groupby("Product_Category")[["Quantity"]].aggregate([min,
                                                        max,
                                                        sum,
                                                        'mean'])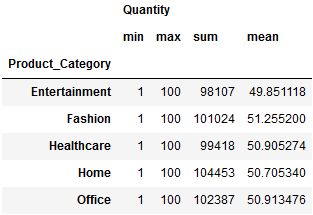
You get all the required statistics about Quantity in each group.
But wait, did you notice something in the list of functions you provided in the .aggregate()??
All the functions such as sum, min, max are written directly but the function mean is written as string i.e. in single quotes like this ‘mean’
But why it is written like a string?? 🚩
As per pandas, the function passed to .aggregate() must be the function which works when passed a DataFrame or passed to DataFrame.apply().
In short, when you mention ‘mean’ (with quotes), .aggregate() searches for a function mean belonging to pd.Series i.e. pd.Series.mean().
Whereas, if you mention mean (without quotes), .aggregate() will search for function named mean in default Python, which is unavailable and will throw an NameError exception.
Further, using .groupby() you can apply different aggregate functions on different columns. In that case you need to pass a dictionary to .aggregate() where keys will be column names and values will be aggregate function which you want to apply.
For example, suppose you want to get a total orders and average quantity in each product category. So the dictionary you will be passing to .aggregate() will be — {‘OrderID’:’count’, ’Quantity’:’mean’}
And you can get the desired output by simply passing this dictionary as below,
function_dictionary = {'OrderID':'count','Quantity':'mean'}
df.groupby("Product_Category").aggregate(function_dictionary)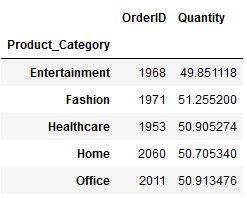
In this way, you can apply multiple functions on multiple columns as you need.
The pandas .groupby() and its GroupBy object is even more flexible. There is a way to get basic statistical summary split by each group with a single function — describe(). You need to specify a required column and apply .describe() on it, as shown below —
df.groupby("Product_Category")[["Quantity"]].describe()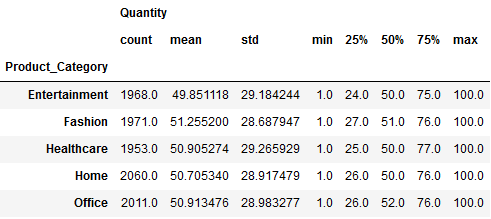
In this way, you can get a complete descriptive statistics summary for Quantity in each product category. As you can see it contains result of individual functions such as count, mean, std, min, max and median.
That’s it! 🏆
I hope you gained valuable insights into pandas .groupby() and its flexibility from this article.
In real world, you usually work on large amount of data and need do similar operation over different groups of data. Pandas .groupby() is quite flexible and handy in all those scenarios.
Interested in reading more stories on Medium??
💡 Consider Becoming a Medium Member to access unlimited stories on medium and daily interesting Medium digest. I will get a small portion of your fee and No additional cost to you.
💡 Be sure to Sign-up to my Email list to never miss another article on data science guides, tricks and tips, SQL and Python.
💡 Here is a complete Notebook with all the examples.
Thank you for reading!


