
5 Indicators you should Know for Trading

Technical analysis is one of the most important aspects of trading. Some traders do it without using indicators, just with price action, but indicators can be powerful and useful if you understand the logic behind them.
I’ll try to explain 5 indicators I think every trader should know.
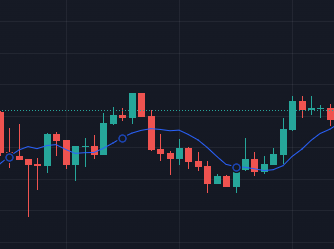
Moving Averages
One of the most widely used indicators in technical analysis is the moving average. A moving average is a trend-following indicator that smooths out price data by calculating the average price over a certain period of time. The resulting line can help traders identify trends and determine support and resistance levels.
There are several types of moving averages, each with its own characteristics. Some of the most common include the simple moving average (SMA), the exponential moving average (EMA), and the weighted moving average (WMA).
- The Simple Moving Average (SMA): it is the most basic type of moving average. It is calculated by summing up the closing prices of a security over a specified period of time and then dividing the result by the number of time periods. For example, a 50-day SMA would be calculated by summing up the closing prices of a security over the past 50 days and then dividing that number by 50.
- The Exponential Moving Average (EMA): it gives more weight to the recent price and less weight to older prices. This makes it more sensitive to recent price changes, which can be useful for identifying trends and making trading decisions.
- The Weighted Moving Average (WMA): it is similar to the EMA, but instead of giving more weight to the most recent prices, it gives more weight to the prices that are closer to the current period. This can be useful for identifying trends and making trading decisions.
Moving averages can be used in many ways. Here are the main signals they can give:
- The direction of the moving average can give the direction of the trend.
- When a shorter-term moving average crosses above a longer-term moving average, it’s called a crossover, and it’s a bullish signal. The opposite is a bearish signal.
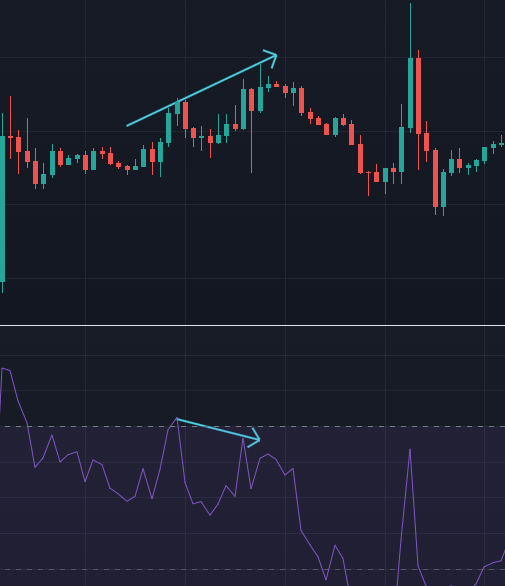
Relative Strength Index
The Relative Strength Index (RSI) is an oscillator that compares the magnitude of recent gains to recent losses in an attempt to determine overbought and oversold conditions of an asset.
The RSI is calculated by using the following formula:
RSI = 100 — (100 / (1 + RS))Where RS is the ratio of the average gain to the average loss.
Values of RSI range from 0 to 100. Traditionally, RSI is considered overbought when above 70 and oversold when below 30. These levels can be adjusted to suit the volatility and characteristics of the asset.
Here are the RSI signals:
- When the RSI is above 70, it indicates that the security is overbought and may be due for a price correction. Conversely, when the RSI is below 30, it indicates that the security is oversold and may be due for a price increase.
- The RSI can also be used to identify potential bullish or bearish divergences, which occur when the RSI is moving in the opposite direction of the price. This can be an early sign that a trend reversal is imminent.
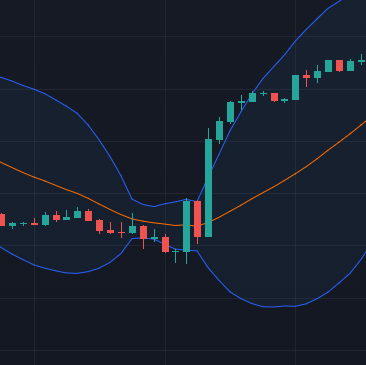
Bollinger Bands
Bollinger Bands consist of a moving average and two standard deviation lines. These bands are used to identify volatility.
The moving average in the middle of the bands is usually a simple moving average (SMA) set to a period of 20. The upper and lower bands are then calculated by adding and subtracting twice the standard deviation of the moving average to the middle band, respectively.
What is the standard deviation?
The standard deviation of a data set is a measure of the spread of the data, and it increases as the volatility of the data increases.
By plotting the standard deviation lines along with the moving average, Bollinger Bands create a dynamic envelope that expands and contracts with changes in volatility.
Bollinger Bands can be used in several ways to make trading decisions:
- When the price touches the upper band, it is considered overbought, and when it touches the lower band, it is considered oversold. This can signal a potential buying or selling opportunity.
- Bollinger Bands can be used to identify trends by looking for the direction of the bands.
- When the bands come close together and volatility is low, after a period of high volatility, it is a Bollinger Bands Squeeze. The Squeeze could be a signal of a potential breakout, once volatility starts to pick up.
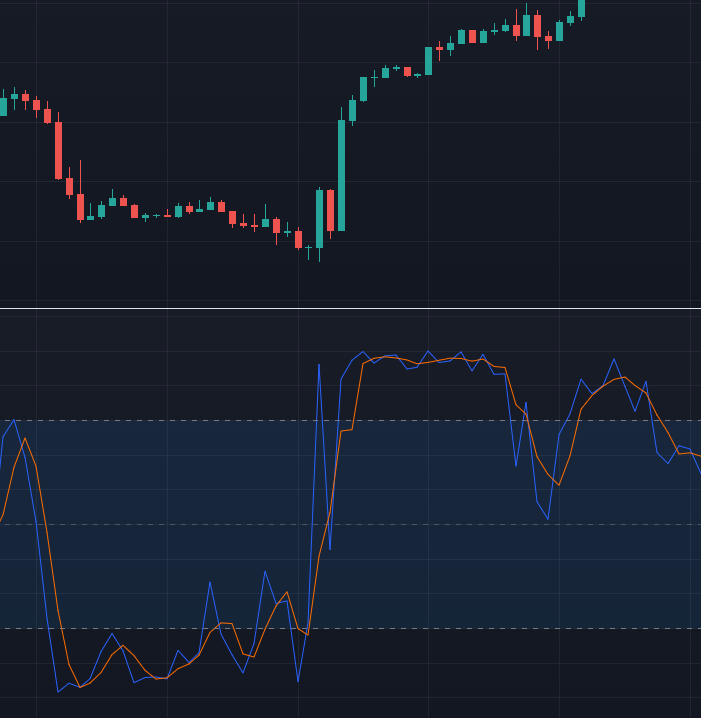
Stochastic
The Stochastic Oscillator is a momentum indicator that compares a security’s closing price to its price range over a given time period. It gives a measurement of the current closing price in relation to the high-low range of a set period, commonly 14 periods.
The Stochastic Oscillator is calculated using the following formula:
%K = (Current Close — Lowest Low) / (Highest High — Lowest Low) * 100The resulting value, %K, is then smoothed using a moving average to create a line called %D.
Like the RSI, it can be used to identify overbought/oversold conditions and divergences. It is considered overbought when it’s above 80 and oversold when it’s below 20.
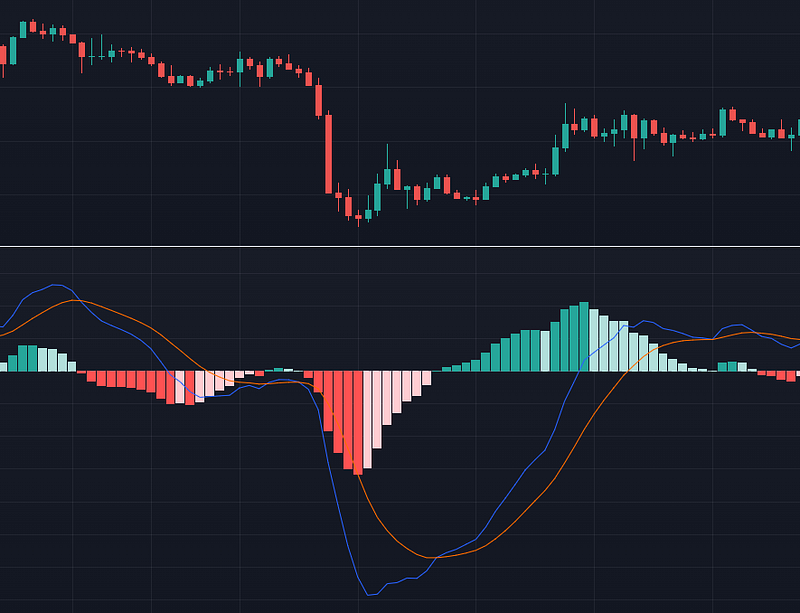
Moving Average Convergence Divergence
The Moving Average Convergence Divergence (MACD) is a trend-following momentum indicator that shows the relationship between two moving averages of a security’s price. It is calculated by subtracting the 26-day moving average of a security’s price from the 12-day moving average. This results in the MACD line.
The MACD also includes a signal line, which is a 9-day moving average of the MACD line. The two lines are plotted on the same chart, along with a histogram that represents the difference between the two lines.
How to use the MACD:
- It generates buy and sell signals based on the crossing of the signal line. A bullish signal is generated when the MACD line crosses above the signal line, and a bearish signal is generated when the MACD line crosses below the signal line.
- The histogram can be used to identify the strength of a trend. When the histogram is positive, it indicates that the short-term average is above the long-term average and the trend is bullish. When the histogram is negative, it indicates that the short-term average is below the long-term average and the trend is bearish.
- Identify potential bullish or bearish divergences, which occur when the MACD is moving in the opposite direction of the price. This can be an early sign that a trend reversal is imminent.
Final Note
It’s important to remember that no indicator can guarantee success in trading, and each of these indicators has its own strengths and weaknesses. It is often helpful to use multiple indicators in combination to gain a more complete understanding of market conditions and make more informed trading decisions. Traders should always consider using multiple signals, confirmations, and other analysis techniques, like price action or Fibonacci retracements, before making a trade decision.
Also, indicators are just tools, and like any tools, they need to be used correctly to work!
To explore more of my trading stories, click here! You can also access all my content by checking this page.
If you liked the story, don’t forget to clap, comment, and maybe follow me if you want to explore more of my content :)
You can also subscribe to me via email to be notified every time I publish a new story, just click here!
If you’re not subscribed to medium yet and wish to support me or get access to all my stories, you can use my link:
A Message from InsiderFinance

Thanks for being a part of our community! Before you go:
- 👏 Clap for the story and follow the author 👉
- 📰 View more content in the InsiderFinance Wire
- 📚 Take our FREE Masterclass
- 📈 Discover Powerful Trading Tools