
5 Hidden Secrets of Pandas to Improve Your Workflow
Exploring hidden gems in the Pandas library

Pandas is the quintessential library for data analysis in Python! The library makes complicated data analysis very simple. However, there are many hidden gems in the library that are tucked away. In this post, you’ll learn five of the top functions and methods available to improve your Pandas workflow.
By the end of this tutorial, you’ll have learned:
- How to improve reading Excel files
- How to master missing data
- How to save space and improve functionality with categorical data
- How to convert continuous variables to categorical
- How to work with comma-seperated survey data
Let’s get started!
Read Excel Files Like a Champ
In many cases, you’ll start your analysis by reading an Excel file. Rather than reading the entire file, then drop columns, convert data types, and handle missing values, you can do all this in one shot!
In many cases, being proactive about how you read your data can improve the performance of your code and make it cleaner to read. Let’s take a look at a dataset with some quirks:
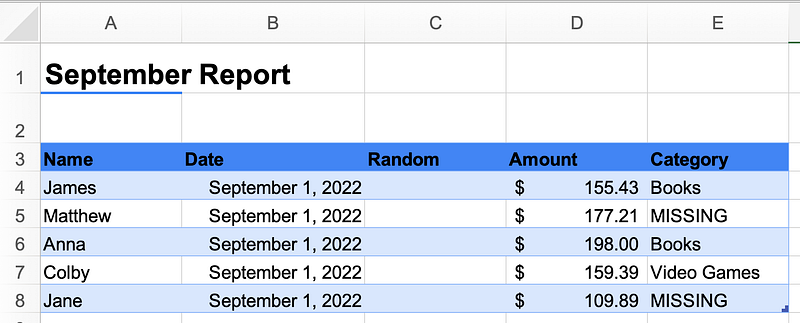
In the report above we can notice a few things:
- The data don’t start until row 3
- There’s a random column that doesn’t contain any data
- We have missing data that isn’t truly missing, but simply labelled as
MISSING - We have a variety of data types
Let’s see how we can use the powerful pd.read_excel() function to handle all of this in one go. To follow along, feel free to download the fictional dataset here (Source: created by author).
Let’s break down what our code does:
skiprows=instructs Pandas to skip a provided number of rowsusecols=allows us to pass in the columns we want to read. In this case, we used Excel ranges!na_values=specifies what values represent missing values. This can be a list of values, too.dtype=accepts a dictionary ofcolumn:datatypekey-value pairs. There’s a bit of a preview here, for reading data as categorical!
In the following section, you’ll learn about how to handle missing data more elegantly.
Improve Handling Missing Data
Pandas provides a helpful missing for dealing with missing data, the .fillna() method. On the surface, the method seems quite simple — and it is. That said, the method also provides quite a lot of useful functionality, especially when combined with other methods.
Take a look at the dataset below:
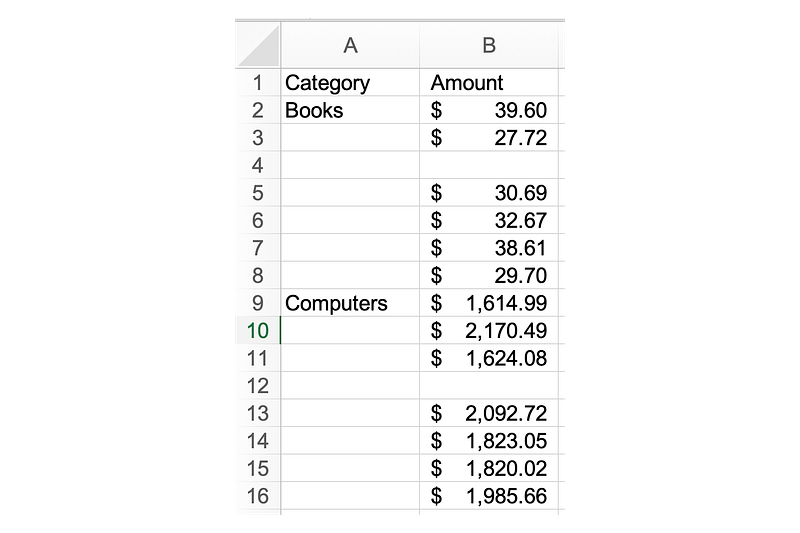
In the dataset above, we have two columns, each with missing data:
- The
Categorycolumn is missing categories which can be filled down - The
Amountcolumn is missing data. In this case, it probably doesn’t make sense to fill with a single value, given the spread of differences in values for each category.
Let’s tackle the Category column first: the .fillna() method has an optional parameter that provides the option to forward-fill data. We can do this by passing in method='ffill' into the function.
The Amount column is a little more complicated: we likely don’t want to fill it with any given value. Since the amount for books and computers is significantly different, simply using the mean of the column would not be appropriate. However, we can use the mean of each group to fill in the missing values.
Let’s see how we can handle both of these operations with Pandas:
In the code above, we were able to use the .groupby() method together with the .fillna() method to fill data with the mean of each group.
Save Space with Categorical Data
In this section, we’ll dive into the wonderful world of categorical data! While this may not sound exciting, categorical data provides many, many benefits. Among these benefits are two key ones:
- Saving a ton of space, and
- Adding custom sort orders to your data
Let’s take a look at how we create categorical data and its space-saving properties first. In the first section, we assigned the data type when we read in our Excel file. While this is the smartest way of handling this, let’s convert a column later on to see how much space this can save.
We can see from the code above that even in a small dataset, converting the data to categorical saves almost 1/3 of the space!
In the next section, you’ll learn how to use categorical data to sort your data via logical categories!
Creating Ordered Categories
To build on what you learned about categorical data in the previous section, we can even create ordered categorical data. This can be helpful when you have logical categorical data, such as ratings of quality or shirt sizes.
Let’s see how we can do this in Pandas:
Let’s break down what the code above accomplishes:
- We created a DataFrame with two columns
- We created a categorical data type that orders our categories in a logical order
- We then converted our column to this new data type
From there, we demo the functionality of this ordered categorical data type by:
- Sorting by shirt size — rather than sorting alphabetically, the data are sorted by the ordering we provided earlier
- We filter our DataFrame using a category and calculate the total number of sales
Explode Your Survey Data
In this final section, we’ll take a look at how you can better work with survey data or, rather, comma-separated values in a column.
In many cases, data you extract from survey tools will have a list of options in a single cell, separated by commas. This isn’t often great to work with, but thankfully Pandas comes to the rescue!
We can see that in our DataFrame, that the Sports column isn’t particularly useful. We can convert this column into something more useful by using the .explode() method, as shown below:
We can see that by exploding our Sports column that we create an unpivoted version of that column, where we can filter to our heart’s content!
Conclusion
In this tutorial, we explored five hidden gems of the Pandas library. The library is full of amazing functionality that lets you explore and manipulate your data in many different ways.


