

5 Elegant Python Pandas Functions
Five beautiful Pandas function for everyday data science usage
In everyday data processing for Machine Learning and Data Science projects, Pandas is one of the most used Python libraries. Like Numpy, Pandas rules the Data Science, Machine Learning and Artificial programming domain with many elegantly built function those add punch to every practitioner’s arsenal. Here I am re-stating some of those elegant functions, which make Pandas such a preferred library to data scientist and machine learning engineer.
(1) shift()
Suppose you encountered a situation where you need to shift all rows in a DataFrame or require to use the previous day stock price in a dataframe. Maybe we want to construct an average temperature of the last three days in a dataset; Shift() would be an ideal way to achieve all these objectives.
Pandas Shift() Function, shifts index by the desired number of periods. This function takes a scalar parameter called a period, which represents the number of shifts for the desired axis. This function is beneficial when dealing with time-series data. We can use fill_value to fill beyond boundary values.
import pandas as pd
import numpy as np
df = pd.DataFrame({'DATE': [1, 2, 3, 4, 5],
'VOLUME': [100, 200, 300,400,500],
'PRICE': [214, 234, 253,272,291]})print(df)
DATE VOLUME PRICE
0 1 100 214
1 2 200 234
2 3 300 253
3 4 400 272
4 5 500 291df.shift(1)DATE VOLUME PRICE
0 NaN NaN NaN
1 1.0 100.0 214.0
2 2.0 200.0 234.0
3 3.0 300.0 253.0
4 4.0 400.0 272.0# with fill_Value = 0df.shift(1,fill_value=0)DATE VOLUME PRICE
0 0 0 0
1 1 100 214
2 2 200 234
3 3 300 253
4 4 400 272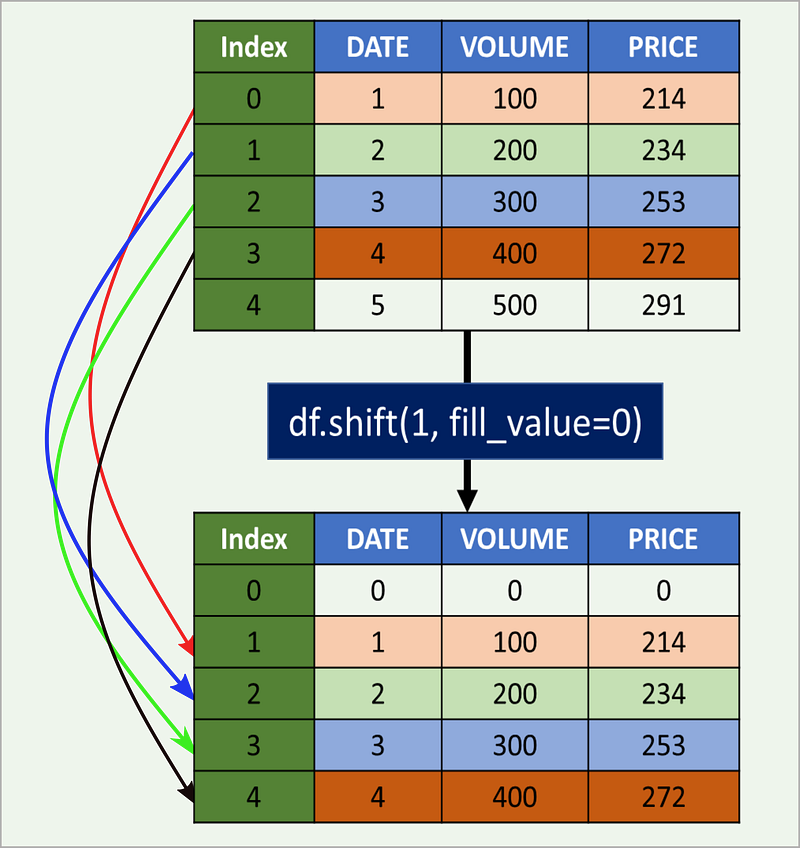
Now, if we need to get the previous day’s stock price as a new column, we can use the shift as below.
df['PREV_DAY_PRICE'] = df['PRICE'].shift(1,fill_value=0)
print(df)
DATE VOLUME PRICE PREV_DAY_PRICE
0 1 100 214 0
1 2 200 234 214
2 3 300 253 234
3 4 400 272 253
4 5 500 291 272We can easily calculate the last three day’s average stock price as below and create a new feature column.
df['LAST_3_DAYS_AVE_PRICE'] = (df['PRICE'].shift(1,fill_value=0) +
                               df['PRICE'].shift(2,fill_value=0) +
                               df['PRICE'].shift(3,fill_value=0))/3
Now dataframe would become
DATE  VOLUME  PRICE     LAST_3_DAYS_AVE_PRICE
0     1     100    214               0.000000
1     2     200    234              71.333333
2     3     300    253             149.333333
3     4     400    272             233.666667
4     5     500    291             253.000000
We can move forward as well to get value from the next timestep or next row.
df['TOMORROW_PRICE'] = df['PRICE'].shift(-1,fill_value=0)Now the data frame would be :
DATE  VOLUME  PRICE     TOMORROW_PRICE
0     1     100    214             234
1     2     200    234             253
2     3     300    253             272
3     4     400    272             291
4     5     500    291               0
More more details on options and other settings, refer to Pandas Documentation.
(2) value_counts()
Pandas value_counts() function returns object containing counts of unique values. The resulting object can be sorted in descending or ascending order, include NA or exclude NA through parameter control. Refer to the w example with a pictorial view. This function can be used with the index or pandas series.
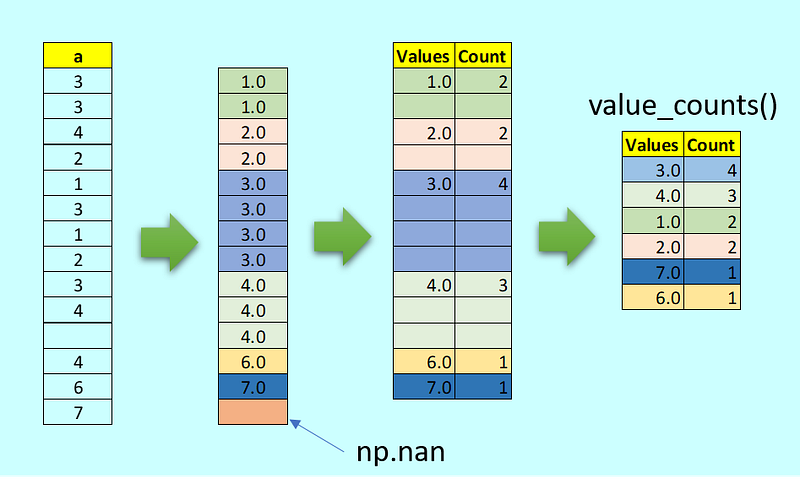
a = pd.Index([3,3,4,2,1,3, 1, 2, 3, 4, np.nan,4,6,7])
a.value_counts()
#Output
3.0 4
4.0 3
1.0 2
2.0 2
7.0 1
6.0 1
dtype: int64Below is one example of the Series.
#Inb = pd.Series(['ab','bc','cd',1,'cd','cd','bc','ab','bc',1,2,3,2,3,np.nan,1,np.nan])
b.value_counts()#Outbc 3
cd 3
1 3
3 2
ab 2
2 2
dtype: int64Bin option can be used instead of counting unique apparitions of values, divide the index in the specified number of half-open bins.
#Ina = pd.Index([3,3,4,2,1,3, 1, 2, 3, 4, np.nan,4,6,7])
a.value_counts(bins=4)#Out(2.5, 4.0] 7
(0.993, 2.5] 4
(5.5, 7.0] 2
(4.0, 5.5] 0
dtype: int64More more details on options and other settings, refer to Pandas Documentation.
(3) mask()
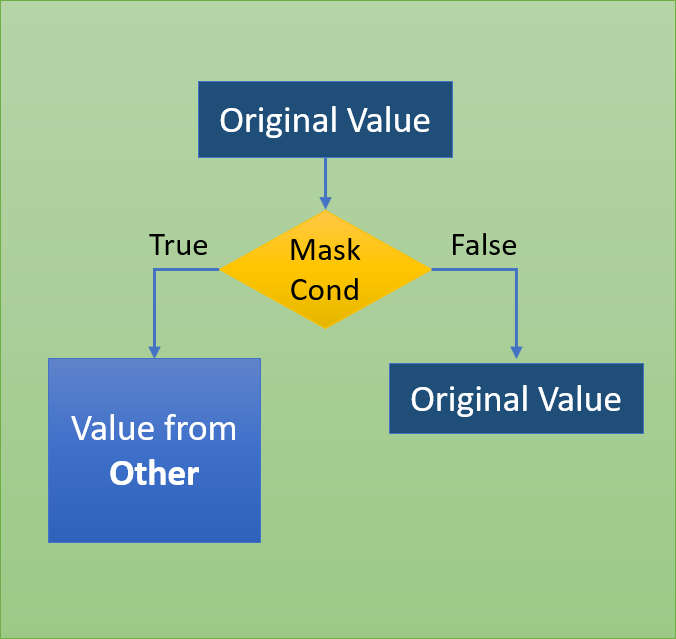
The mask method is an application of the if-then condition for each element of a Series or DataFrame. If Cond is True, then it uses the value from Other (default value is NaN) else would retain the original value. This mask() method is quite similar to where().
Refer to below DataFrame, where we want to change the sign of all the elements which are divisible by two without the remainder.
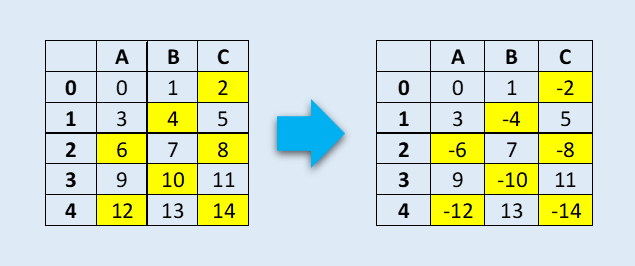
This can be easily achieved by mask function.
df = pd.DataFrame(np.arange(15).reshape(-1, 3), columns=['A', 'B','C'])
print(df)
#Out
A B C
0 0 1 2
1 3 4 5
2 6 7 8
3 9 10 11
4 12 13 14#mask operation to check if element is divided by 2 without any remainder. If match change the sign of the element as originaldf.mask(df % 2 == 0,-df)#OutA B C
0 0 1 -2
1 3 -4 5
2 -6 7 -8
3 9 -10 11
4 -12 13 -14More more details on options and other settings, refer to Pandas Documentation.
(4) nlargest()
On many occasions, we encounter situations where we need to find the top 3 or bottom five values for a Series or DataFrame (like top-performing three students with their aggregate score or three bottom candidates with the total number of votes obtained in an election.
Pandas nlargest() and nsmallest() is the best answer for such data processing requirements.
The below example shows the three largest height from a DataFrame of 10 observations.
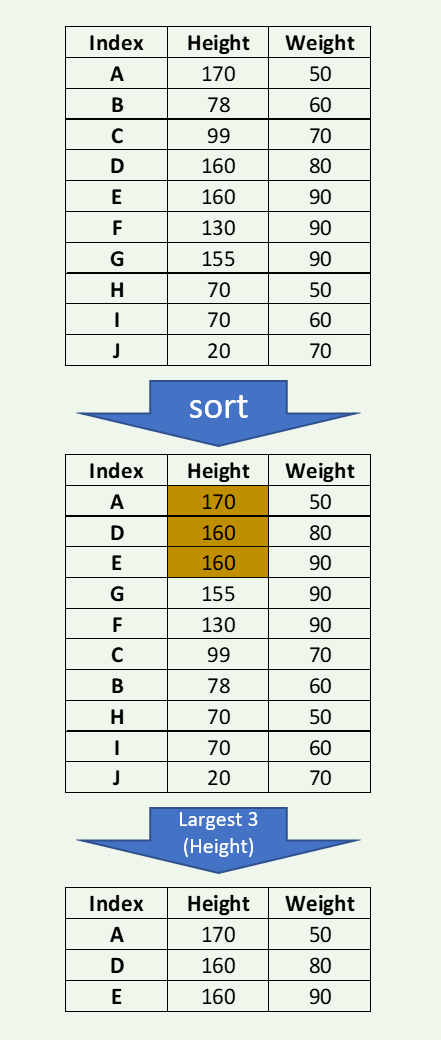
import pandas as pd
import numpy as np
df = pd.DataFrame({'HEIGHT': [170,78,99,160,160,130,155,70,70,20],
'WEIGHT': [50,60,70,80,90,90,90,50,60,70]},
index=['A','B','C','D','E','F','G','H','I','J'])print(df)HEIGHT WEIGHT
A 170 50
B 78 60
C 99 70
D 160 80
E 160 90
F 130 90
G 155 90
H 70 50
I 70 60
J 20 70dfl = df.nlargest(3,'HEIGHT')
print(dfl)HEIGHT WEIGHT
A 170 50
D 160 80
E 160 90If there is a tie, then there are few options to resolve using ‘first,’ ‘last,’ ‘all’ (default is ‘first’). Keep all occurrences. We will try to find the two largest heights in the examples below.
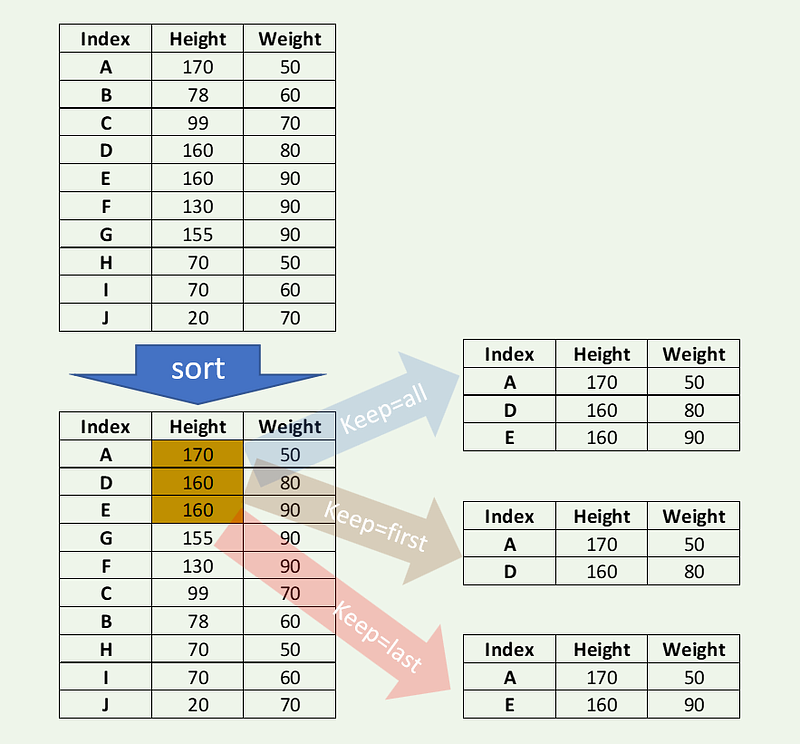
dfl = df.nlargest(2,'HEIGHT',keep='all')
print(dfl)
HEIGHT WEIGHT
A 170 50
D 160 80
E 160 90Keep the last occurrence.
dfl = df.nlargest(2,'HEIGHT',keep='last')
print(dfl)
HEIGHT WEIGHT
A 170 50
E 160 90Keep the first occurrence.
dfl = df.nlargest(2,'HEIGHT',keep='first')
print(dfl)
HEIGHT WEIGHT
A 170 50
D 160 80More more details on options and other settings, refer to Pandas Documentation.
5) nsmallest()
nsmallest() also works similarly but with idiom smallest filter in mind. Refer to the example below, where we now use weight to find two smallest weights.
import pandas as pd
import numpy as np
df = pd.DataFrame({'HEIGHT': [170,78,99,160,160,130,155,70,70,20],
'WEIGHT': [50,60,70,80,90,90,90,50,60,70]},
index=['A','B','C','D','E','F','G','H','I','J'])print(df)HEIGHT WEIGHT
A 170 50
B 78 60
C 99 70
D 160 80
E 160 90
F 130 90
G 155 90
H 70 50
I 70 60
J 20 70dfs = df.nsmallest(3,'WEIGHT')
print(dfs)HEIGHT WEIGHT
A 170 50
H 70 50
B 78 60More details on options and other settings, refer to Pandas Documentation.
Final Note :
These are five pandas functions that are not just elegant but also expressive. In my view, we should use them whenever there is a similar situation as these provide not just less code but mostly a smart way of achieving a solution for a complex problem.
Thanks for reading. You can connect me @ LinkedIn .
For only $5/month, get unlimited access to the most inspiring and uplifting content… Click on the link below to become a Medium member and support my writing. Thank you! https://baijayanta.medium.com/membership
You may also like my other article on Pandas.