
Algorithmic Trading
Bitcoin Price Prediction: 4 Steps with Deep Learning
Or any Time Series Data — It’s easier than you think
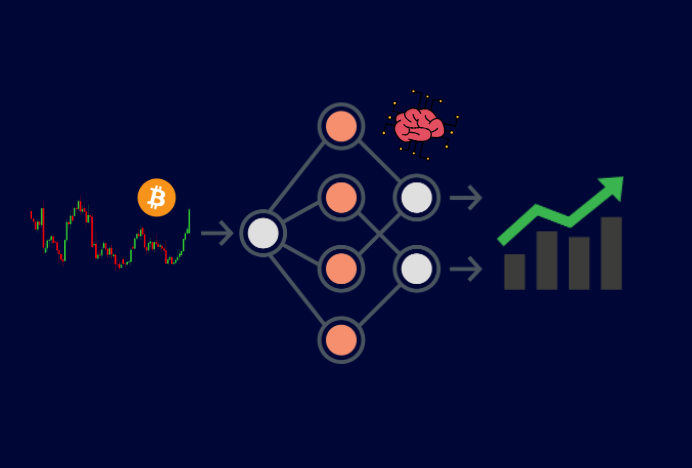
We’ve all thought about it. What if, we create an ML program that analyses the market movements of a stock or bitcoin? You’d be surprised by how simple it is. Here we formulate our model conceptually via a Jupyter Notebook to predict the daily direction of bitcoin prices. Then we’ll discuss possible deployments for the future.
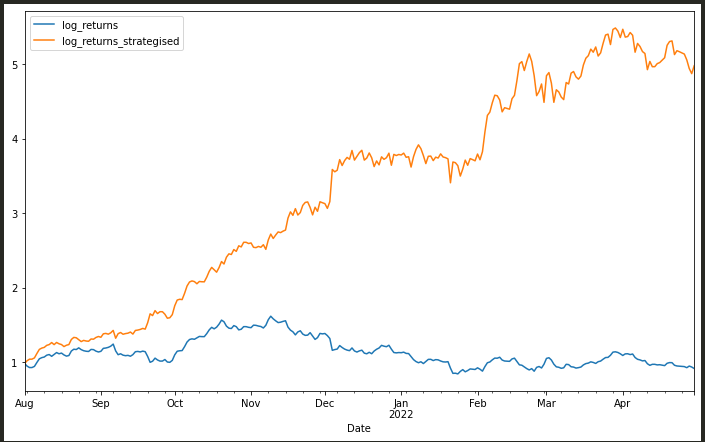
As an example, below is a figure of the cumulative logarithmic returns for bitcoin if we followed the predictions of our model from Aug 2021. In a hypothetical world, if a bot instantaneously bought when the direction would go up, and sold when it goes down; without any buy/selling fees. We would see what we see below for cumulative logarithmic returns (orange). Blue would be the cumulative log returns if we passively invested once without actively trading. Quite a difference right?
Note: I am not a financial advisor and I am not giving you financial advice. Results vary depending on variables and market stock/coin. We are exploring conception and hopefully inspiring you to do more with this!
What do we want to predict?
It’s important to note that we will be predicting direction rather than the actual price for the day. It is much simpler and more accurate to do this. Besides, do we really need to know more than whether or not it's going up or down? If we had a trading bot, the bot would simply just need to know if it’s going up or down today. So it knows when to buy or sell. Nothing more.
In our predictions, we will be looking at daily granularity and the outputs will be 1 for going up and -1 for going down.
Pre-requisites: Deep Learning
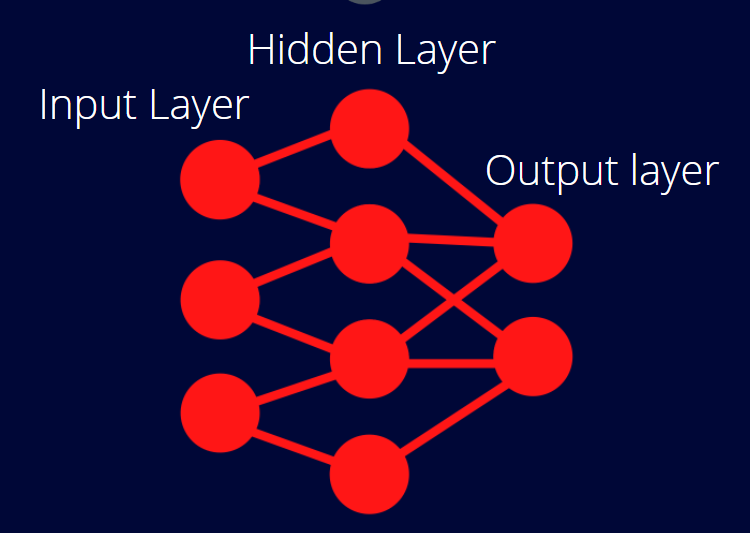
Without going into too much detail, you’ll need to know at least conceptually what Deep learning is. Deep learning with a dense neural network are models inspired by the human brain. They tend to be trained by using a large data set with 3 sets of layers: input layer, hidden layer(s), and output layer. There can be many different hidden layers. Through every node in the layer, it performs simple operations on the data and sends the results to the next layer nodes. After each layer, it focuses on a higher level feature than the previous until the output. Below is the depiction
For a deep dive into Deep Learning, I recommend going here:
The following code will use a dense neural network (DNN) with Keras (and TensorFlow in the background. We will specify feature columns and labels to fit the classifier.
The Steps
Before we get going, the whole notebook is available here, feel free to have a look/clone/download:
Importing the required packages:
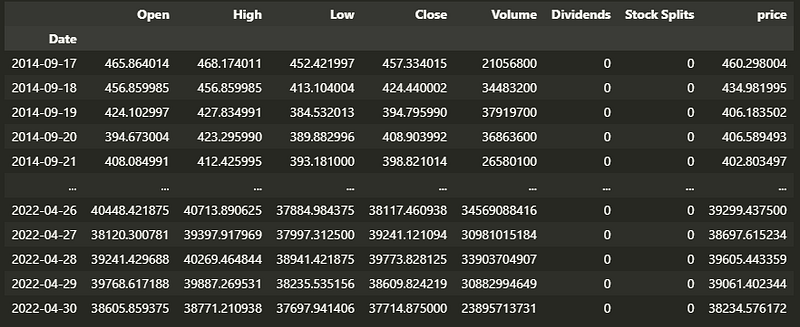
1) Getting the Raw Data
You’ll need to get historical price data of some sort, we use yfinance (the python package). The more data the better. It’s up to you to decide what data is particularly relevant, for example, for training data, 2020 was not a simple year, so this may skew our model terribly.
We’re pulling in:
- We’re going to use bitcoin-USD price data
- Data from 2010
- Period of data to be in daily granularity
2) Creating the features and position
As with any model, we need feature columns. For this we will use four types of features:
- Lags: lag columns are basically the previous day(s) return depending on which lag number. So one feature might be lag 1 (log returns one day before), lag 2 (price two days before) and so on. We will create 7 lag columns as features.
- Momentum: The Rolling mean
- Volatility: Rolling standard deviation
- Distance
We’ll also create a column called Position (AKA direction of price), which is the target column we’d want to predict. 1 indicates the price went up, and 0 for down.
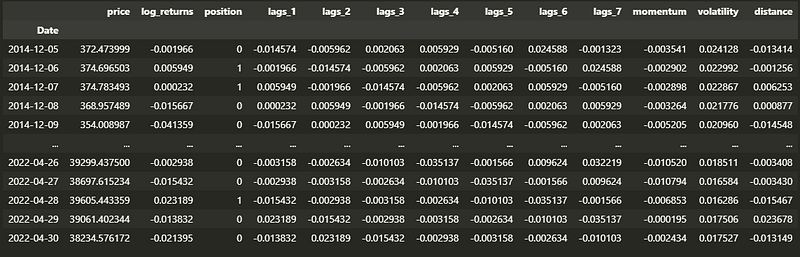
As seen above, 10 new features: lags, momentum, volatility, and distance. The position is our target variable to predict.
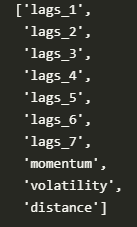
You’ll also need a list of the column feature names:
3) The Model
Here we have the training of the model. I’ve documented the steps in the comments of the code. Feel free to vary the dates and see how they affect your model.
Just a few things to note before reading:
- I convert the data to normal dist (line 12), this is common in ML to standardize the data.
- I set a random seed for consistency. You should vary the seed to see how much it varies the model.
- I use the sequential model, in which I’ve specified 3 layers. The last layer output has 1 in it, just as we only need one output. I’ve used activation = relu, which is Rectified linear unit. It’s one of the best activation functions for deep learning and is suitable for our binary output model as it outputs a 0 whenever the log returns are negative. The last layer uses sigmoid; it’s important to note that its output will be from 0 to 1 and we’ll consider > 0.5 to be a positive direction prediction.
Let’s evaluate the accuracy of our model:
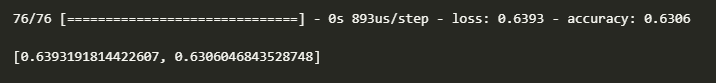
Accuracy of 0.631, let’s be honest, over time, an accuracy of 0.63 is pretty good for something so random! I’d rather be 63% right than 50% random guesses!
4) Predicting the test data
Let’s now predict the test data. Below I predict the direction of the price of the day. 1 being up, -1 being down. Again, as I said in step 4, according to sigmoid, above 0.5 will mean up, i.e. 1 (line 7).
Notice on line 18 I plot the cumulative log returns. Imagine in a beautiful perfect world we have a bot that trades bitcoin for us every day with ZERO fees. This is never the case because there’s always a fee! But if this was the case, the bot would buy before it goes up, and sell before it goes down. In this perfect world below is what we see with logarithmic returns (orange) starting from August 2021 till May 2022. Blue is if you simply invested, and did nothing. Our model with 0.63 accuracies gives us a lot more returns!
Note that in this particular case with bitcoin and these dates it worked out well, but not all coins/stocks behave the same. Some are too volatile, some are too dependent on external factors, and some are simply too hard to predict. Or maybe, we aren’t using the right numbers for the right time series. So this will not work for everything!
Next steps — Productionising
We cover conception in this article, but how do we get this to make us $$$$$? We’d have to productionise it. Some things to consider:
- Tweak and build on this conception code to be suitable for your use case.
- Create classes, functions, and modules and turn them into a python application that continually trains the model and applies daily prediction.
- Implement a real time ticker to get the data in real time
- Consider the use of creating a bot, that can trade for you in real time with low fees. I recommend looking into Oanda as an API for you to execute such functions.
- Host your application on the cloud to run 24–7. If you want something super simple, look into droplet and host there. However, I recommend AWS to be your go to.
Final word
I hope you found this read interesting! Perhaps even inspired you to take this further and use for your own explorations. Try different random seeds, stocks, crypto’s etc. I will be writing a follow up on this in future on productionising this code for bitcoin.
If you’ve enjoyed this article, please leave a clap and a follow for support!
Or if you’re interested in joining the Medium community and you’re not yet one, here’s a referral link:
References
A lot of my knowledge and implementation from this article came from a book called “Python for Algorithmic trading”, by Yves Hilpisch, certainly a recommended read!


