
4 easy steps to create a KPI with an indicator in Power BI
Power BI is a platform that allows you to connect to various data sources, transform and model your data, and create interactive dashboards and reports. Power BI can help you gain insights from your data and communicate them effectively.
What is a KPI?
A KPI, or a key performance indicator, is a measurable target that shows how well an individual or a business is performing in terms of meeting their goals. KPIs can be financial, such as net profit or revenue, or nonfinancial, such as customer satisfaction or retention. KPIs help organizations track their progress, identify their strengths and weaknesses, and make informed decisions to improve their outcomes.
Building the KPI
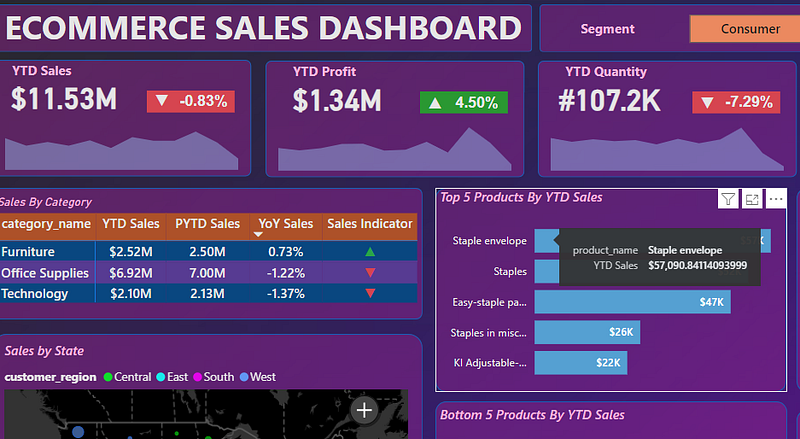
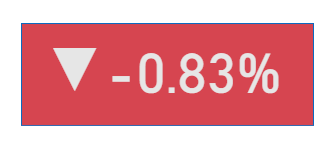
We will be making this KPI:

So to calculate YoY Sales first we need YTD Sales and PYTD Sales which require the need for a calendar table because there is a requirement of creating a calendar table whenever we are dealing with dates in Power BI.
1.DAX for calendar table creation:
Calender = CALENDAR(MIN(ecommerce_data[order_date]), MAX(ecommerce_data[order_date]))

where the arguments are the start and end dates in the main table which here is ecommerce_data and the MIN() and MAX() functions give us the min and max dates in ecommerce_data table which are nothing but our start and end dates.
Then this calendar table needs to be connected to the main table in data modelling section of Power BI. Just drag Date column in calendar table to the respective date column in main table. Refer this article for connecting the tables, it is very easy to do.
2.DAX for YoY Sales:
As mentioned earlier YoY Sales requires YTD Sales and PYTD Sales so we will calculate them first.
YTD Sales = TOTALYTD(SUM(ecommerce_data[sales_per_order]), Calender[Date])

PYTD Sales = CALCULATE(SUM(ecommerce_data[sales_per_order]), SAMEPERIODLASTYEAR(Calender[Date]))

Now I have already written an article about what YTD and PYTD are and how their DAX work so please refer to this link for knowing that, trust me it is very easy.
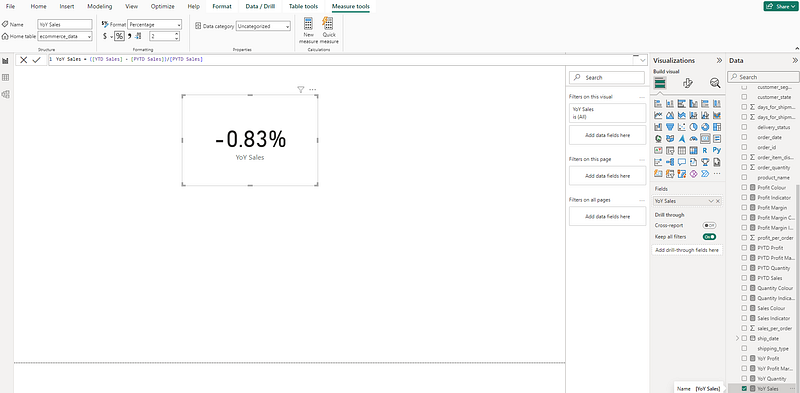
YoY Sales = ([YTD Sales] — [PYTD Sales])/[PYTD Sales]

Now just take a card visual from Visualization pane and place YoY Sales to it. Also select YoY Sales from Data pane then a measure tools option will come above from which click on % icon and give 2 value to decimal digits.
3.DAX for Indicator Creation:
Sales Indicator = var positive_icon = UNICHAR(9650)
var negative_icon = UNICHAR(9660)
var result = IF([YoY Sales]>0, positive_icon, negative_icon)
return result
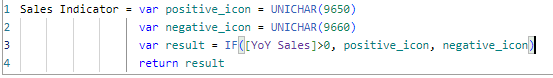
here we are creating two variables positive icon and negative icon with positive icon getting a value of UNICHAR(9650) where 9650 is unichar value of ▲ and for negative icon we are giving UNICHAR(9660) where 9660 is unichar value of ▼.
now we will create a third variable result where we run a IF condition i.e. if YoY Sales > 0(positive) then result will take ▲ and if YoY Sales <0(negative) then result will take ▼ and finally we return the result.
4.DAX for Background Colour:
Now we want the background to take Green or Red colour depending on the YoY Sales value for which we will use a DAX:
Sales Colour = IF([YoY Sales]>0,”Green”,”Red”)

Its simple, IF YoY Sales>0 then Sales Colour = Green and if IF YoY Sales<0 then Sales Colour = Red.
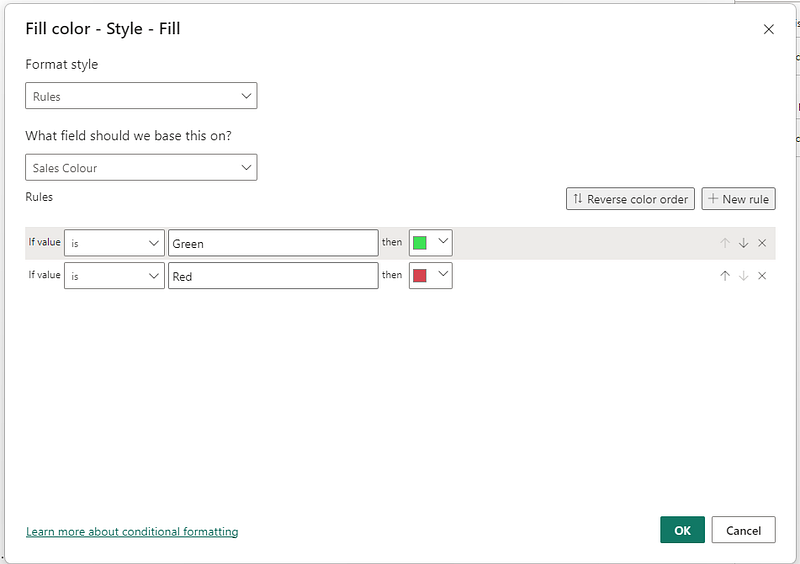
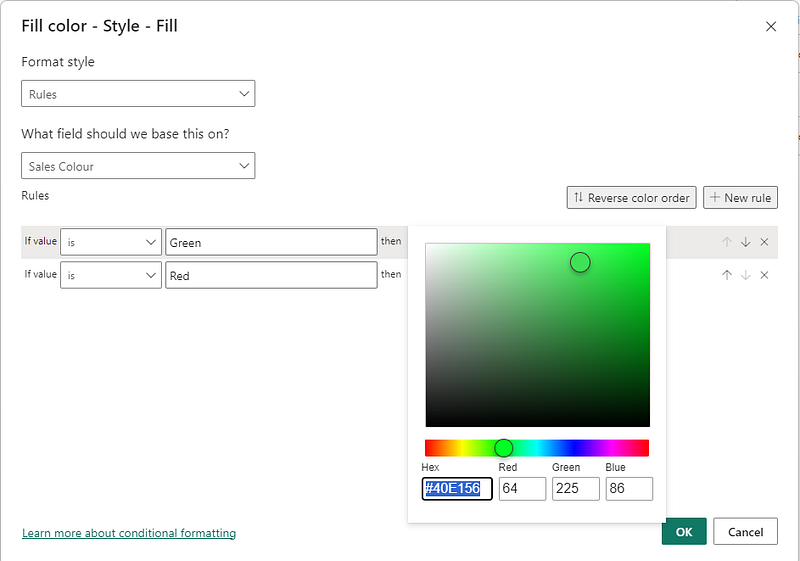
Now just go to Insert and add a rectangle from shapes. Then create the rectangle select it and in Format pane go to Shape, Style and Fill and click fx. Now in Format Style choose Rules and in field select Sales Colour then type Green and Red in the same way as you wrote in the IF condition of Sales Colour. Then choose the colours from More colors.. if needed and press OK.
Finally put the YoY Sales and Sales Indicator in cards if not done already and put it over the rectangle created and your KPI is created.
To create a Concatenated KPI refer to this link.
To read more stories like this you can follow me with this link.
References:
- https://www.investopedia.com/terms/k/kpi.asp
- https://www.forbes.com/advisor/business/what-is-a-kpi-definition-examples/
- https://en.wikipedia.org/wiki/Performance_indicator
Don’t forget to subscribe to
👉 Power BI Publication
👉 Power BI Newsletter
and join our Power BI community
👉 Power BI Masterclass