
Data Science
4 All Time Useful Tricks Of Pandas Group By
A One-stop-solution For All Your Questions About Data Aggregation Using Pandas Groupby

In Python, pandas is a commonly used library for data analysis. With its many built-in functions and methods, it makes data analysis faster and easier.
One of the most important aspects of data analysis is data aggregation, which helps you group the data by one variable and aggregate the rest of the numeric data to get summary statistics. And ultimately, you can use these summary statistics to answer the business question.
That’s where pandas function — groupby() — is useful, which groups the data based on values from a categorical or non-numerical column and helps you to analyse the data by these newly formed groups.
In my one of the past article — 5 Pandas Group By Tricks You Should Know in Python — you can learn what is groupby and how to use it.
In this article, I am explaining 4 highly useful and often googled pandas groupby tricks with examples, which you must know to effectively perform data analysis.
I’ve also attached a complete Jupyter-Notebook with all the examples by the end of this article.
Let’s get started!
For this article, I’m using the most popular dataset on UC Irvine Machine Learning Repository — Iris — which is created by R.A. Fisher and available under CC BY 4.0 license.
Let’s import the dataset into pandas DataFrame — df
import pandas as pd
df = pd.read_csv("iris.data",
                 header=None,
                 names=["sepal_length", "sepal_width",
                        "petal_length","petal_width","class"])
df.head()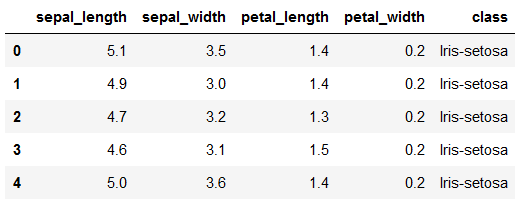
It is a simple 150 x 5 dataset containing the information of 3 classes of the Iris plant.
Let’s start with the first use-case, assuming that you already explored how to use groupby in my previous article as mentioned above.
Applying different functions to different columns
In Pandas groupby, you can group all the rows of the dataset by categorical/non-numerical column and apply a function to aggregate the other desired numerical columns.
For example, suppose you would like to get the sepal length for each class of the Iris plant. You can simply pass the column class in groupby and use sum() function on the column sepal_length, as shown below.
df.groupby('class')['sepal_length'].sum()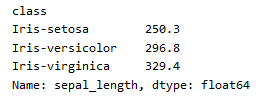
It is quite straightforward.
But what if you would like to get a total sepal length and average sepal width for each class?
That’s where the agg() function jumps in, which is used to apply aggregate functions on pandas DataFrame groupby object obtained by using pandas.DataFrame.groupby.
Certainly, you don’t need to use groupby() multiple times, rather you can create a single groupby object and pass the column and its aggregate function as key-value pair in the agg() function.
Let’s see how to do it.
Here two columns on which you want to apply aggregate functions are — sepal_length and sepal_width—and the actual aggregate functions you want to apply on these columns are, sum and mean
Therefore, the key-value pair, i.e. the dictionary, will look like
dict1 = {'sepal_length':'sum', 'sepal_width':'mean'}Whereas the groupby object will be created as:
groupby_object = df.groupby(["class"])And then you can apply function agg() on this groupby object as below,
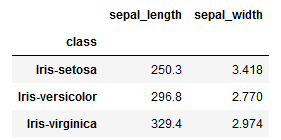
groupby_object.agg(dict1)
To get an output like —
Well, you don’t need to split the code into 3 distinct lines, which I did just to simplify the things.
You’ll get exactly the same output by clubbing everything in the single line of code as below.
df.groupby(["class"]).agg({'sepal_length':'sum', 'sepal_width':'mean'})Extending the same logic, you can apply multiple functions on the same column, but in slightly different way.
Applying multiple functions to the same column
Often, you need to find out multiple statistics for the same column separated by a category, such as computing the minimum and maximum values. To do this, you can pass a list of functions to the agg() method.
For an instance, suppose you would like to get minimum, maximum, and median values of sepal length for each class of the Iris plant.
The actual aggregate functions you want to apply on this column are min, max and median, which you must pass as a list as shown below.
df.groupby('class')['sepal_length'].agg(['min', 'max', 'median'])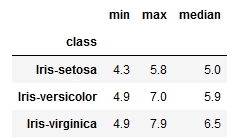
Following the same way, you can apply multiple functions on multiple columns at the same time.
For example, in addition to above calculations, you can also get the same metrics for sepal width.
As this is a multiple column scenario, you should switch back to key-value pair for column name and function name as you did in the previous method. However, instead of single function name, this time you will pass the list of function names as shown below.
df.groupby(["class"]).agg({'sepal_length':['min', 'max', 'median'],
                           'sepal_width':['min', 'max', 'median']})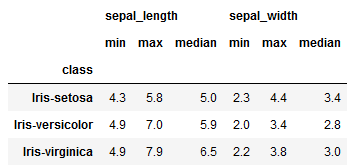
As a result, you’ll get an easy to understand DataFrame.
However, it still has two rows as column heading and you can get rid of them by simply renaming the aggregated columns.
Customize aggregation column names
You can use the names of your choice for the column aggregations so that you can easily identify the returned column aggregations and get rid of 2nd row in the column headings.
All you need to do is make a tuple of column name and aggregate function and assign this tuple to a column name.
Continuing the above example, you want to apply function ‘min’ on the column sepal_length, so the tuple will be (‘sepal_length’, ‘min’) and you will assign this tuple to the column named min_sepal_length as shown below.
min_sepal_length = ('sepal_length','min')Similarly, you can create tuples for all the column aggregations and assign them to a custom name.
min_sepal_length = ('sepal_length','min')
max_sepal_length = ('sepal_length','max')
median_sepal_length = ('sepal_length','median')

min_sepal_width = ('sepal_width','min')
max_sepal_width = ('sepal_width','max')
median_sepal_width = ('sepal_width','median')
And finally pass them in the agg() function separated by comma as shown below.
df.groupby(["class"]).agg(min_sepal_length = ('sepal_length','min'),
                          max_sepal_length = ('sepal_length','max'),
                          median_sepal_length = ('sepal_length','median'),
                          min_sepal_width = ('sepal_width','min'),
                          max_sepal_width = ('sepal_width','max'),
                          median_sepal_width = ('sepal_width','median'))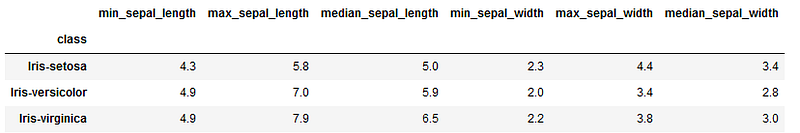
Quick it is!
Now, this looks much simplified and easy-to-read output.
So far, you applied only the standard or built-in functions on one or more columns. However, sometimes you need to apply an user-defined function and using aggregate function you can easily do that.
Applying custom or user-defined functions
Often the built-in aggregation functions in pandas are not sufficient for your needs and you define your own custom functions for your analysis.
Now, you can apply these user-defined or custom function to grouped data using the agg method.
For example, suppose you defined a custom function to compute the range of a column as follows.
def my_range(x):
    return x.max() - x.min()
And now you would like to get the range for sepal length, sepal width, petal length and petal width of the Iris plant separated by its class.
Again this is multiple columns scenario, so you must use a key-value pairs where key is the column name and value is the name of the user-defined function as shown below.
df.groupby(["class"]).agg({'sepal_length':my_range,
                           'sepal_width':my_range,
                           'petal_length':my_range,
                           'petal_width':my_range})
This will quickly give you an output as —
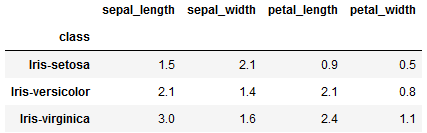
However, it will be difficult for viewer of the above DataFrame to understand which type of aggregate function is used to get these numbers.
Therefore, adding more context make sense here, which can be achieved by adding maximum and minimum values for each column.
Interestingly, you can also combine user-defined functions with built-in functions and apply them to multiple columns in the agg() function.
Let’s take another example.
Suppose, you would like to compute minimum, maximum and above user-defined function for all the numerical columns in the dataset.
And now this is multiple columns — multiple functions scenario which means you’ll still use key-value pairs but pass list of functions as a value, as shown below.
df.groupby(["class"]).agg({'sepal_length':['min', 'max', my_range],
                           'sepal_width':['min', 'max', my_range],
                           'petal_length':['min', 'max', my_range],
                           'petal_width':['min', 'max', my_range]})
To get an quick output as —
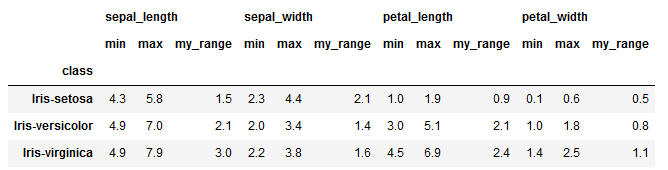
Interesting, right?
But it is still difficult to say what’s there in the function my_range and what type of computation happens in this function.
It makes more sense to give a meaningful name to this function and then use the function again for aggregation.
You can easily assign a name for the function using below code.
my_range.__name__ = 'Max - Min'And then re-apply the function my_range on all the required columns as,
df.groupby(["class"]).agg({'sepal_length':['min', 'max', my_range],
                           'sepal_width':['min', 'max', my_range],
                           'petal_length':['min', 'max', my_range],
                           'petal_width':['min', 'max', my_range]})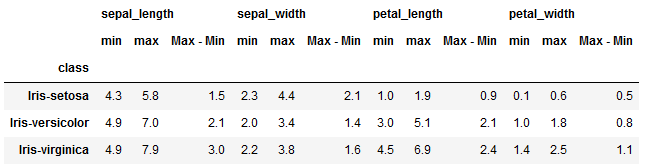
Now, this output looks much more useful as it tells you exactly what type of calculations were performed on each column.
That’s all about data aggregation using pandas groupby! 🏆
I hope you found this article useful and saved it as a one-stop-solution for pandas .groupby() use cases.
Knowing these flexibility features about data aggregation using pandas .groupby() can certainly boost your productivity. It also helps you to aggregate and represent the data in better and easy-to-understand way.
Interested in reading more stories on Medium??
💡 Consider Becoming a Medium Member to access unlimited stories on medium and daily interesting Medium digest. I will get a small portion of your fee and No additional cost to you.
💡 Be sure to Sign-up to my Email list to never miss another article on data science guides, tricks and tips, SQL and Python.
💡 Here is a complete Notebook with all the examples.
Thank you for reading!


