Free AI web copilot to create summaries, insights and extended knowledge, download it at here
13860
Abstract
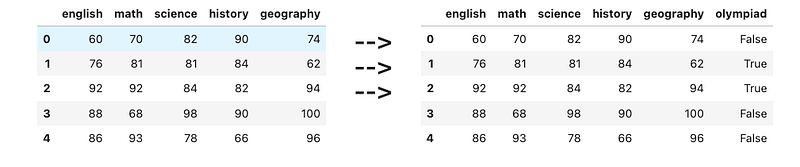
ing">'science'</span>, <span class="hljs-string">'history'</span>, <span class="hljs-string">'geography'</span>])</pre></div><p id="6a25">A student is eligible for math olympiad if both math and science scores are <i>above </i>80. Create a new column <code>olympiad</code> containing boolean values. True means the student is eligible for the math olympiad, and False means that the student is not eligible.</p><figure id="a929"><img src="https://cdn-images-1.readmedium.com/v2/resize:fit:800/1*YG3ARBHV-kfRc2SRAlDiJw.png"><figcaption></figcaption></figure><h1 id="dc4b">** Questions</h1><h2 id="04d8">11) Finding the mean + median per subject</h2><div id="1e34"><pre>df = pd.DataFrame([
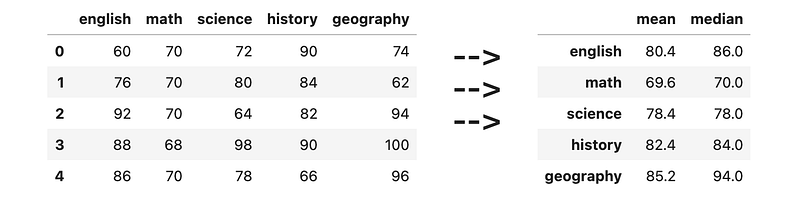
[<span class="hljs-number">60</span>, <span class="hljs-number">70</span>, <span class="hljs-number">72</span>, <span class="hljs-number">90</span>, <span class="hljs-number">74</span>],
[<span class="hljs-number">76</span>, <span class="hljs-number">70</span>, <span class="hljs-number">80</span>, <span class="hljs-number">84</span>, <span class="hljs-number">62</span>],
[<span class="hljs-number">92</span>, <span class="hljs-number">70</span>, <span class="hljs-number">64</span>, <span class="hljs-number">82</span>, <span class="hljs-number">94</span>],
[<span class="hljs-number">88</span>, <span class="hljs-number">68</span>, <span class="hljs-number">98</span>, <span class="hljs-number">90</span>, <span class="hljs-number">100</span>],
[<span class="hljs-number">86</span>, <span class="hljs-number">70</span>, <span class="hljs-number">78</span>, <span class="hljs-number">66</span>, <span class="hljs-number">96</span>],
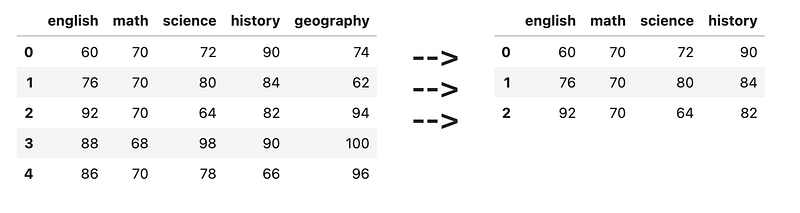
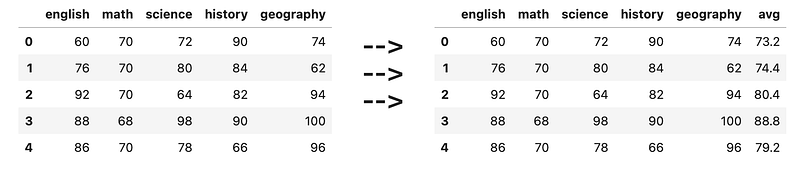
], columns=[<span class="hljs-string">'english'</span>, <span class="hljs-string">'math'</span>, <span class="hljs-string">'science'</span>, <span class="hljs-string">'history'</span>, <span class="hljs-string">'geography'</span>])</pre></div><figure id="052a"><img src="https://cdn-images-1.readmedium.com/v2/resize:fit:800/1*KJGs84VIlsGVx70wtfw6UA.png"><figcaption></figcaption></figure><h2 id="0267">12) Filling NaN with median of column</h2><div id="9f15"><pre>df = pd.DataFrame([
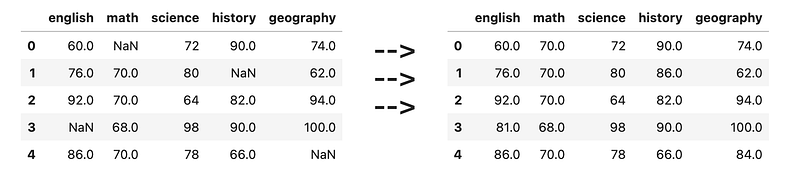
[<span class="hljs-number">60</span>, <span class="hljs-literal">None</span>, <span class="hljs-number">72</span>, <span class="hljs-number">90</span>, <span class="hljs-number">74</span>],
[<span class="hljs-number">76</span>, <span class="hljs-number">70</span>, <span class="hljs-number">80</span>, <span class="hljs-literal">None</span>, <span class="hljs-number">62</span>],
[<span class="hljs-number">92</span>, <span class="hljs-number">70</span>, <span class="hljs-number">64</span>, <span class="hljs-number">82</span>, <span class="hljs-number">94</span>],
[<span class="hljs-literal">None</span>, <span class="hljs-number">68</span>, <span class="hljs-number">98</span>, <span class="hljs-number">90</span>, <span class="hljs-number">100</span>],
[<span class="hljs-number">86</span>, <span class="hljs-number">70</span>, <span class="hljs-number">78</span>, <span class="hljs-number">66</span>, <span class="hljs-literal">None</span>],
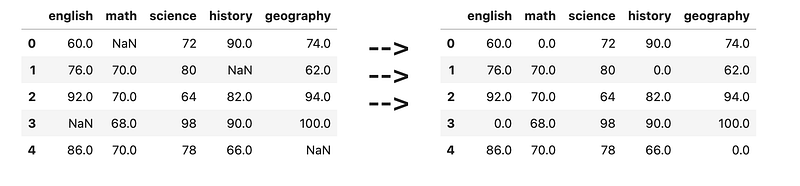
], columns=[<span class="hljs-string">'english'</span>, <span class="hljs-string">'math'</span>, <span class="hljs-string">'science'</span>, <span class="hljs-string">'history'</span>, <span class="hljs-string">'geography'</span>])</pre></div><figure id="157e"><img src="https://cdn-images-1.readmedium.com/v2/resize:fit:800/1*a2EJKJ5YZJT9GZIYKinlMw.png"><figcaption></figcaption></figure><h2 id="4cb0">13) Average (mean) price per shop</h2><div id="b07a"><pre>df = pd.DataFrame([
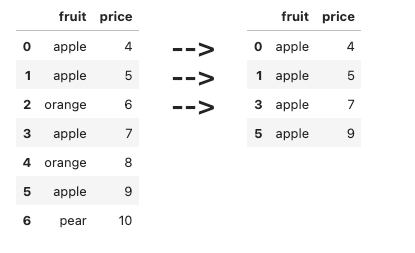
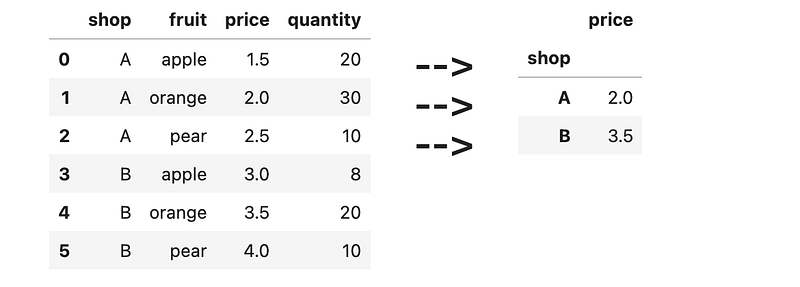
[<span class="hljs-string">'A'</span>, <span class="hljs-string">'apple'</span>, <span class="hljs-number">1.5</span>, <span class="hljs-number">20</span>],
[<span class="hljs-string">'A'</span>, <span class="hljs-string">'orange'</span>, <span class="hljs-number">2.0</span>, <span class="hljs-number">30</span>],
[<span class="hljs-string">'A'</span>, <span class="hljs-string">'pear'</span>, <span class="hljs-number">2.5</span>, <span class="hljs-number">10</span>],
[<span class="hljs-string">'B'</span>, <span class="hljs-string">'apple'</span>, <span class="hljs-number">3.0</span>, <span class="hljs-number">8</span>],
[<span class="hljs-string">'B'</span>, <span class="hljs-string">'orange'</span>, <span class="hljs-number">3.5</span>, <span class="hljs-number">20</span>],
[<span class="hljs-string">'B'</span>, <span class="hljs-string">'pear'</span>, <span class="hljs-number">4.0</span>, <span class="hljs-number">10</span>],
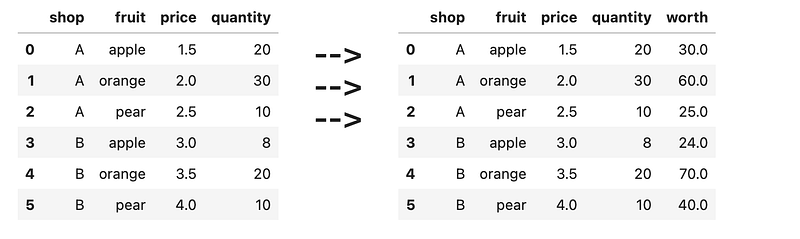
], columns=[<span class="hljs-string">'shop'</span>, <span class="hljs-string">'fruit'</span>, <span class="hljs-string">'price'</span>, <span class="hljs-string">'quantity'</span>])</pre></div><figure id="fdaf"><img src="https://cdn-images-1.readmedium.com/v2/resize:fit:800/1*jPLxcYq0K8d3m86wupQ4sQ.png"><figcaption></figcaption></figure><h2 id="4be3">14) Average (median) price per fruit</h2><div id="5d23"><pre>df = pd.DataFrame([
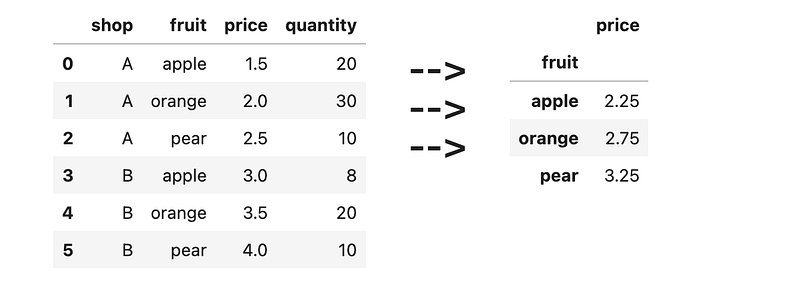
[<span class="hljs-string">'A'</span>, <span class="hljs-string">'apple'</span>, <span class="hljs-number">1.5</span>, <span class="hljs-number">20</span>],
[<span class="hljs-string">'A'</span>, <span class="hljs-string">'orange'</span>, <span class="hljs-number">2.0</span>, <span class="hljs-number">30</span>],
[<span class="hljs-string">'A'</span>, <span class="hljs-string">'pear'</span>, <span class="hljs-number">2.5</span>, <span class="hljs-number">10</span>],
[<span class="hljs-string">'B'</span>, <span class="hljs-string">'apple'</span>, <span class="hljs-number">3.0</span>, <span class="hljs-number">8</span>],
[<span class="hljs-string">'B'</span>, <span class="hljs-string">'orange'</span>, <span class="hljs-number">3.5</span>, <span class="hljs-number">20</span>],
[<span class="hljs-string">'B'</span>, <span class="hljs-string">'pear'</span>, <span class="hljs-number">4.0</span>, <span class="hljs-number">10</span>],
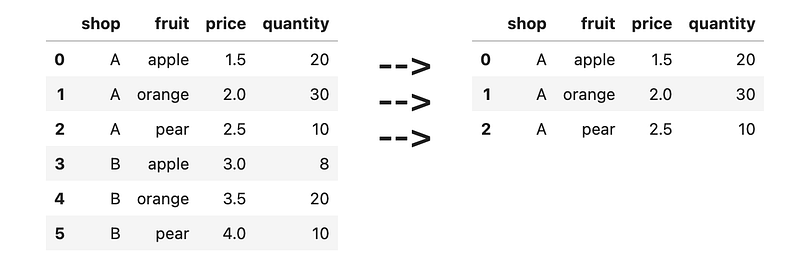
], columns=[<span class="hljs-string">'shop'</span>, <span class="hljs-string">'fruit'</span>, <span class="hljs-string">'price'</span>, <span class="hljs-string">'quantity'</span>])</pre></div><figure id="fe61"><img src="https://cdn-images-1.readmedium.com/v2/resize:fit:800/1*EkeY0fTmixRcp1BfDWRWLA.png"><figcaption></figcaption></figure><h2 id="e9ae">15) Area, Circumference, Volume and Surface Area</h2><div id="a449"><pre>df = pd.DataFrame([
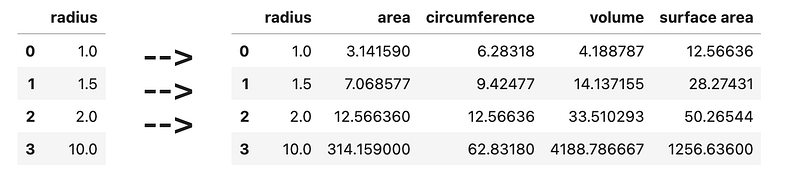
[<span class="hljs-number">1</span>],
[<span class="hljs-number">1.5</span>],
[<span class="hljs-number">2</span>],
[<span class="hljs-number">10</span>]
], columns=[<span class="hljs-string">'radius'</span>])</pre></div><p id="ff03">Where <code>radius</code> represents the radius of a circle/sphere, and:</p><ul><li>pi = 3.14159</li><li>area = pi * radius²</li><li>circumference = 2 * pi * radius</li><li>volume = 4 / 3 * pi * radius³</li><li>suface area = 4 * pi * radius²</li></ul><figure id="4145"><img src="https://cdn-images-1.readmedium.com/v2/resize:fit:800/1*6T1NGKFnGaRMnGCZTgcf6A.png"><figcaption></figcaption></figure><h2 id="22c4">16) Email feature extraction</h2><div id="8cef"><pre>df = pd.DataFrame([
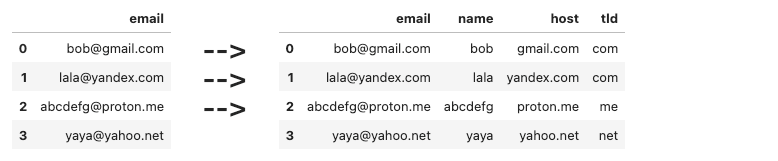
[<span class="hljs-string">'[email protected]'</span>],
[<span class="hljs-string">'[email protected]'</span>],
[<span class="hljs-string">'[email protected]'</span>],
[<span class="hljs-string">'[email protected]'</span>],
], columns=[<span class="hljs-string">'email'</span>])</pre></div><p id="aff0">Write some code to extract the following information</p><ul><li><code>name</code> — the stuff before the <code>@</code></li><li><code>host</code> — the stuff after the <code>@</code></li><li><code>tld</code> — the stuff after the last <code>.</code></li></ul><figure id="c50d"><img src="https://cdn-images-1.readmedium.com/v2/resize:fit:800/1*px02cnpk0ab6znWrgddSjA.png"><figcaption></figcaption></figure><h2 id="39d2">17) Moving datetime column to index</h2><div id="7344"><pre>df = pd.DataFrame([
[<span class="hljs-string">'2022-01-03'</span>, <span class="hljs-number">100</span>],
[<span class="hljs-string">'2022-01-02'</span>, <span class="hljs-number">110</span>],
[<span class="hljs-string">'2022-01-01'</span>, <span class="hljs-number">120</span>],
[<span class="hljs-string">'2022-01-08'</span>, <span class="hljs-number">130</span>],
[<span class="hljs-string">'2022-01-05'</span>, <span class="hljs-number">120</span>],
[<span class="hljs-string">'2022-01-06'</span>, <span class="hljs-number">140</span>],
[<span class="hljs-string">'2022-01-07'</span>, <span class="hljs-number">150</span>],
[<span class="hljs-string">'2022-01-04'</span>, <span class="hljs-number">120</span>],
], columns=[<span class="hljs-string">'date'</span>, <span class="hljs-string">'price'</span>])</pre></div><p id="91c2">Write some code to first convert the datetime column to actual datetime objects, then move it to the index of the dataframe. Remember to sort the values by date.</p><figure id="08a6"><img src="https://cdn-images-1.readmedium.com/v2/resize:fit:800/1*kx50iKFW-ilsCeITQBU-4A.png"><figcaption></figcaption></figure><h2 id="0173">18) Mean value per month</h2><div id="20f3"><pre>df = pd.DataFrame([
[<span class="hljs-string">'2022-01-03'</span>, <span class="hljs-number">100</span>],
[<span class="hljs-string">'2022-01-02'</span>, <span class="hljs-number">110</span>],
[<span class="hljs-string">'2022-01-01'</span>, <span class="hljs-number">120</span>],
[<span class="hljs-string">'2022-02-08'</span>, <span class="hljs-number">130</span>],
[<span class="hljs-string">'2022-02-05'</span>, <span class="hljs-number">120</span>],
[<span class="hljs-string">'2022-05-06'</span>, <span class="hljs-number">140</span>],
[<span class="hljs-string">'2022-05-07'</span>, <span class="hljs-number">150</span>],
[<span class="hljs-string">'2022-05-04'</span>, <span class="hljs-number">120</span>],
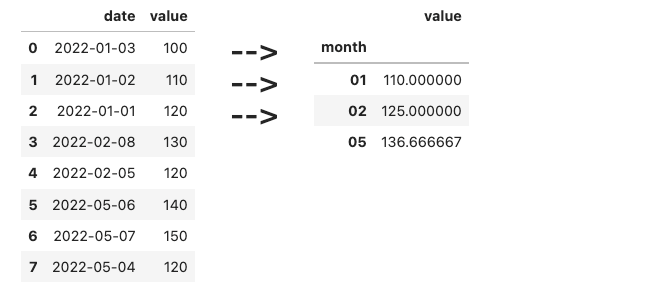
], columns=[<span class="hljs-string">'date'</span>, <span class="hljs-string">'value'</span>])</pre></div><p id="e401">Here, the dates are in <code>yyyy-mm-dd</code> format. Find the average value per month.</p><figure id="436b"><img src="https://cdn-images-1.readmedium.com/v2/resize:fit:800/1*NIUviY8Tk2x5gJlblXZV-g.png"><figcaption></figcaption></figure><h2 id="db18">19) Cleaning dirty numbers</h2><div id="fab6"><pre>df = pd.DataFrame([
[<span class="hljs-string">'A'</span>, <span class="hljs-string">'100,000'</span>],
[<span class="hljs-string">'B'</span>, <span class="hljs-string">'80,000'</span>],
[<span class="hljs-string">'C'</span>, <span class="hljs-string">'20,200'</span>],
[<span class="hljs-string">'D'</span>, <span class="hljs-string">'50,000'</span>],
[<span class="hljs-string">'E'</span>, <span class="hljs-string">'10,000'</span>],
], columns=[<span class="hljs-string">'item'</span>, <span class="hljs-string">'cost'</span>])</pre></div><p id="74cd">Here, the numbers have commas in them, causing pandas to think that they are strings. Convert each number string to an actual number.</p><figure id="97c2"><img src="https://cdn-images-1.readmedium.com/v2/resize:fit:800/1*N79VC4Rf_InUZLVONtRcpg.png"><figcaption></figcaption></figure><h2 id="d425">20) Fixing duplicated entries</h2><div id="5b4f"><pre>df = pd.DataFrame([
[<span class="hljs-string">'A'</span>, <span class="hljs-number">20</span>],
[<span class="hljs-string">'B'</span>, <span class="hljs-number">25</span>],
[<span class="hljs-string">'C'</span>, <span class="hljs-number">40</span>],
[<span class="hljs-string">'A'</span>, <span class="hljs-number">22</span>],
[<span class="hljs-string">'B'</span>, <span class="hljs-number">1</span>],
[<span class="hljs-string">'A'</span>, <span class="hljs-number">1</span>],
], columns=[<span class="hljs-string">'item'</span>, <span class="hljs-string">'quantity'</span>])</pre></div><p id="d243">Here, multiple items and their quantities are duplicated instead of combined. Write some code to combine them instead.</p><figure id="52fe"><img src="https://cdn-images-1.readmedium.com/v2/resize:fit:800/1*iOQ1fFlxylSCfXXGSRQhug.png"><figcaption></figcaption></figure><h1 id="2b81">*** Questions</h1><h2 id="0aeb">21) Storage conversion</h2><div id="f79f"><pre>df = pd.DataFrame([
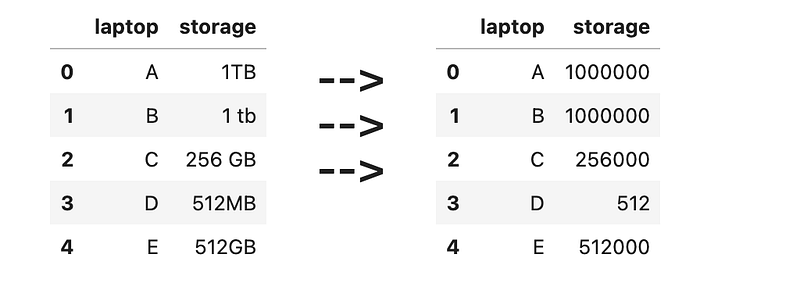
[<span class="hljs-string">'A'</span>, <span class="hljs-string">'1TB'</span>],
[<span class="hljs-string">'B'</span>, <span class="hljs-string">'1 tb'</span>],
[<span class="hljs-string">'C'</span>, <span class="hljs-string">'256 GB'</span>],
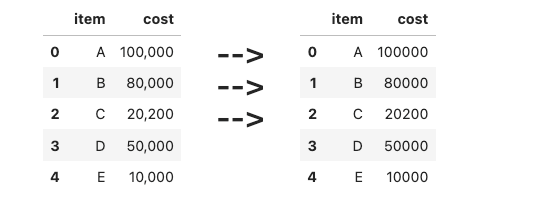
[<span class="hljs-string">'D'</span>, <span class="hljs-string">'512MB'</span>],
[<span class="hljs-string">'E'</span>, <span class="hljs-string">'512GB'</span>],
], columns=[<span class="hljs-string">'laptop'</span>, <span class="hljs-string">'storage'</span>])</pre></div><p id="d6ad">Let’s assume that:</p><ul><li>1 TB == 1000 GB</li><li>1 GB == 1000 MB</li></ul><p id="a888">Clean the ‘storage’ column, and convert the values to megabytes. Be careful of the inconsistent spaces/casing.</p><figure id="e4e2"><img src="https://cdn-images-1.readmedium.com/v2/resize:fit:800/1*fLU_Or2xzJbxTtbxhp7RUA.png"><figcaption></figcaption></figure><h2 id="24bf">22) Feature extraction from dirty data</h2><div id="27c0"><pre>df = pd.DataFrame([
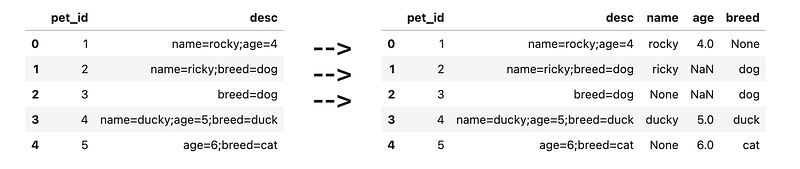
[<span class="hljs-number">1</span>, <span class="hljs-string">'name=rocky;age=4'</span>],
[<span class="hljs-number">2</span>, <span class="hljs-string">'name=ricky;breed=dog'</span>],
[<span class="hljs-number">3</span>, <span class="hljs-string">'breed=dog'</span>],
[<span class="hljs-number">4</span>, <span class="hljs-string">'name=ducky;age=5;breed=duck'</span>],
[<span class="hljs-number">5</span>, <span class="hljs-string">'age=6;breed=cat'</span>],
], columns=[<span class="hljs-string">'pet_id'</span>, <span class="hljs-string">'desc'</span>])</pre></div><p id="58
Options
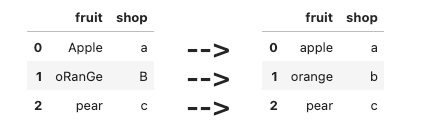
2f">Here, the <code>desc</code> column contains multiple key-value pairs stored in the form <code>key1=value1;key2=value2</code></p><figure id="4eaf"><img src="https://cdn-images-1.readmedium.com/v2/resize:fit:800/1*7nc_BYvRpnVT-z9fUeGXVA.png"><figcaption></figcaption></figure><h2 id="0987">23) Grading scores</h2><div id="adaf"><pre>df = pd.DataFrame([
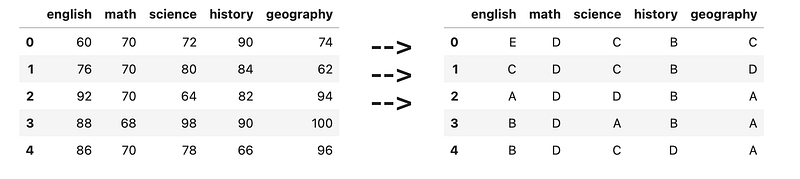
[<span class="hljs-number">60</span>, <span class="hljs-number">70</span>, <span class="hljs-number">72</span>, <span class="hljs-number">90</span>, <span class="hljs-number">74</span>],
[<span class="hljs-number">76</span>, <span class="hljs-number">70</span>, <span class="hljs-number">80</span>, <span class="hljs-number">84</span>, <span class="hljs-number">62</span>],
[<span class="hljs-number">92</span>, <span class="hljs-number">70</span>, <span class="hljs-number">64</span>, <span class="hljs-number">82</span>, <span class="hljs-number">94</span>],
[<span class="hljs-number">88</span>, <span class="hljs-number">68</span>, <span class="hljs-number">98</span>, <span class="hljs-number">90</span>, <span class="hljs-number">100</span>],
[<span class="hljs-number">86</span>, <span class="hljs-number">70</span>, <span class="hljs-number">78</span>, <span class="hljs-number">66</span>, <span class="hljs-number">96</span>],
], columns=[<span class="hljs-string">'english'</span>, <span class="hljs-string">'math'</span>, <span class="hljs-string">'science'</span>, <span class="hljs-string">'history'</span>, <span class="hljs-string">'geography'</span>])</pre></div><p id="2c86">Convert each score to a grade:</p><ul><li>91 to 100 → A</li><li>81 to 90 → B</li><li>71 to 80 → C</li><li>61 to 70 → D</li><li>60 and below → E</li></ul><figure id="e7b9"><img src="https://cdn-images-1.readmedium.com/v2/resize:fit:800/1*veW926e9zj6s1ey4MPhh9w.png"><figcaption></figcaption></figure><h2 id="38b7">24) Ranking scores</h2><div id="93c1"><pre>df = pd.DataFrame([
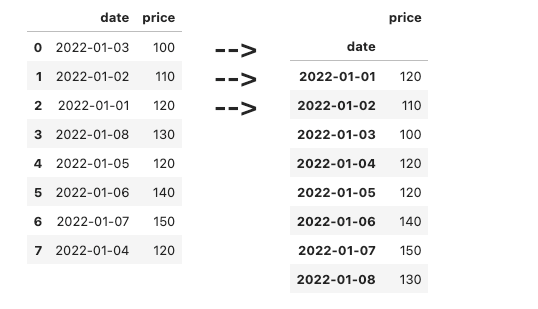
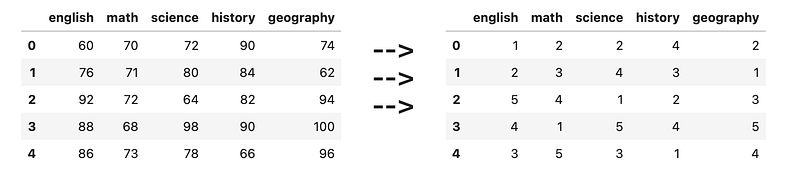
[<span class="hljs-number">60</span>, <span class="hljs-number">70</span>, <span class="hljs-number">72</span>, <span class="hljs-number">90</span>, <span class="hljs-number">74</span>],
[<span class="hljs-number">76</span>, <span class="hljs-number">71</span>, <span class="hljs-number">80</span>, <span class="hljs-number">84</span>, <span class="hljs-number">62</span>],
[<span class="hljs-number">92</span>, <span class="hljs-number">72</span>, <span class="hljs-number">64</span>, <span class="hljs-number">82</span>, <span class="hljs-number">94</span>],
[<span class="hljs-number">88</span>, <span class="hljs-number">68</span>, <span class="hljs-number">98</span>, <span class="hljs-number">90</span>, <span class="hljs-number">100</span>],
[<span class="hljs-number">86</span>, <span class="hljs-number">73</span>, <span class="hljs-number">78</span>, <span class="hljs-number">66</span>, <span class="hljs-number">96</span>],
], columns=[<span class="hljs-string">'english'</span>, <span class="hljs-string">'math'</span>, <span class="hljs-string">'science'</span>, <span class="hljs-string">'history'</span>, <span class="hljs-string">'geography'</span>]</pre></div><p id="b878">For each subject, rank each student’s scores using numbers 1 to 5.</p><figure id="221c"><img src="https://cdn-images-1.readmedium.com/v2/resize:fit:800/1*8OaZr-BbvyvVbjQBmpsrnQ.png"><figcaption></figcaption></figure><h2 id="8e66">25) Outlier Detection</h2><div id="65cb"><pre>df = pd.DataFrame([
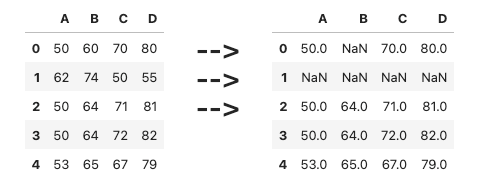
[<span class="hljs-number">50</span>,<span class="hljs-number">60</span>,<span class="hljs-number">70</span>,<span class="hljs-number">80</span>],
[<span class="hljs-number">62</span>,<span class="hljs-number">74</span>,<span class="hljs-number">50</span>,<span class="hljs-number">55</span>],
[<span class="hljs-number">50</span>,<span class="hljs-number">64</span>,<span class="hljs-number">71</span>,<span class="hljs-number">81</span>],
[<span class="hljs-number">50</span>,<span class="hljs-number">64</span>,<span class="hljs-number">72</span>,<span class="hljs-number">82</span>],
[<span class="hljs-number">53</span>,<span class="hljs-number">65</span>,<span class="hljs-number">67</span>,<span class="hljs-number">79</span>],
], columns=[<span class="hljs-string">'A'</span>, <span class="hljs-string">'B'</span>, <span class="hljs-string">'C'</span>, <span class="hljs-string">'D'</span>])</pre></div><p id="5c88">Here, a value is considered an outlier as compared to the other values in its column if:</p><ul><li>It is more than (mean of column) + (standard deviation of column)</li><li>It is less than (mean of column) - (standard deviation of column)</li></ul><figure id="ff86"><img src="https://cdn-images-1.readmedium.com/v2/resize:fit:800/1*9GlBOPN-Ghqx710TxpMCgg.png"><figcaption></figcaption></figure><h2 id="d172">26) Dirty data</h2><div id="8f2d"><pre>df = pd.DataFrame([
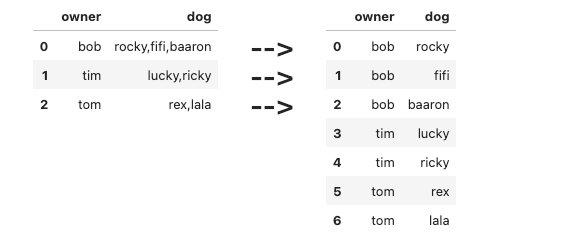
[<span class="hljs-string">'bob'</span>, <span class="hljs-string">'rocky,fifi,baaron'</span>],
[<span class="hljs-string">'tim'</span>, <span class="hljs-string">'lucky,ricky'</span>],
[<span class="hljs-string">'tom'</span>, <span class="hljs-string">'rex,lala'</span>]
], columns=[<span class="hljs-string">'owner'</span>, <span class="hljs-string">'dog'</span>])</pre></div><figure id="6335"><img src="https://cdn-images-1.readmedium.com/v2/resize:fit:800/1*HxPMhVQt2ugGufwgMbZ3kA.png"><figcaption></figcaption></figure><h2 id="e325">27) Average number per country per team</h2><div id="2f7b"><pre>df = pd.DataFrame([
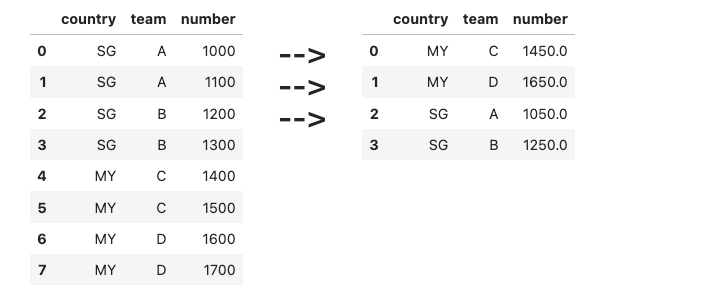
[<span class="hljs-string">'SG'</span>, <span class="hljs-string">'A'</span>, <span class="hljs-number">1000</span>],
[<span class="hljs-string">'SG'</span>, <span class="hljs-string">'A'</span>, <span class="hljs-number">1100</span>],
[<span class="hljs-string">'SG'</span>, <span class="hljs-string">'B'</span>, <span class="hljs-number">1200</span>],
[<span class="hljs-string">'SG'</span>, <span class="hljs-string">'B'</span>, <span class="hljs-number">1300</span>],
[<span class="hljs-string">'MY'</span>, <span class="hljs-string">'C'</span>, <span class="hljs-number">1400</span>],
[<span class="hljs-string">'MY'</span>, <span class="hljs-string">'C'</span>, <span class="hljs-number">1500</span>],
[<span class="hljs-string">'MY'</span>, <span class="hljs-string">'D'</span>, <span class="hljs-number">1600</span>],
[<span class="hljs-string">'MY'</span>, <span class="hljs-string">'D'</span>, <span class="hljs-number">1700</span>],
], columns=[<span class="hljs-string">'country'</span>, <span class="hljs-string">'team'</span>, <span class="hljs-string">'number'</span>])</pre></div><p id="97a8">Find the average <code>number</code> per country per team.</p><figure id="8bfe"><img src="https://cdn-images-1.readmedium.com/v2/resize:fit:800/1*ICnRUZv8CdinUWxRu7LkEA.png"><figcaption></figcaption></figure><h2 id="953f">28) Expanding columns</h2><div id="60e1"><pre>df = pd.DataFrame([
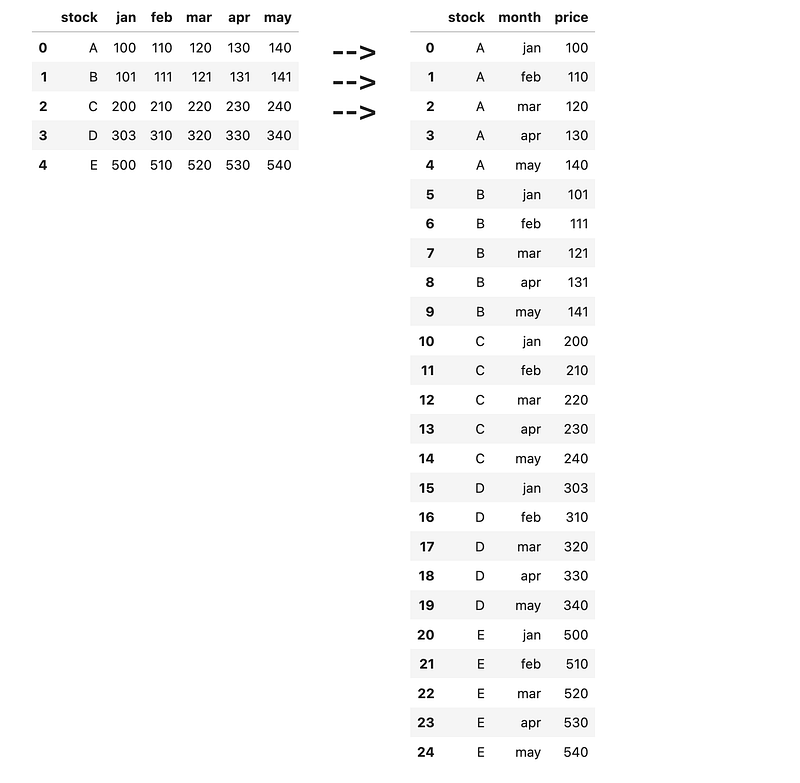
[<span class="hljs-string">'A'</span>, <span class="hljs-number">100</span>, <span class="hljs-number">110</span>, <span class="hljs-number">120</span>, <span class="hljs-number">130</span>, <span class="hljs-number">140</span>],
[<span class="hljs-string">'B'</span>, <span class="hljs-number">101</span>, <span class="hljs-number">111</span>, <span class="hljs-number">121</span>, <span class="hljs-number">131</span>, <span class="hljs-number">141</span>],
[<span class="hljs-string">'C'</span>, <span class="hljs-number">200</span>, <span class="hljs-number">210</span>, <span class="hljs-number">220</span>, <span class="hljs-number">230</span>, <span class="hljs-number">240</span>],
[<span class="hljs-string">'D'</span>, <span class="hljs-number">303</span>, <span class="hljs-number">310</span>, <span class="hljs-number">320</span>, <span class="hljs-number">330</span>, <span class="hljs-number">340</span>],
[<span class="hljs-string">'E'</span>, <span class="hljs-number">500</span>, <span class="hljs-number">510</span>, <span class="hljs-number">520</span>, <span class="hljs-number">530</span>, <span class="hljs-number">540</span>],
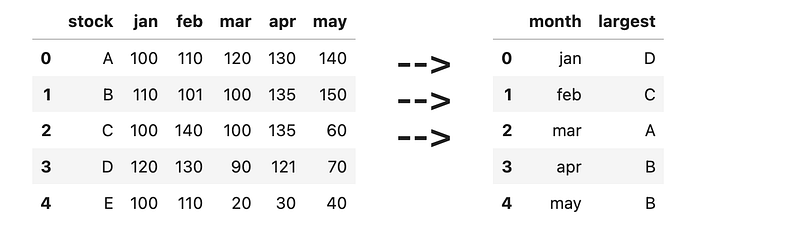
], columns=[<span class="hljs-string">'stock'</span>, <span class="hljs-string">'jan'</span>, <span class="hljs-string">'feb'</span>, <span class="hljs-string">'mar'</span>, <span class="hljs-string">'apr'</span>, <span class="hljs-string">'may'</span>])</pre></div><p id="cef0">^ This dataframe above might not be very friendly for analysis. Write some code to convert it into the new dataframe below.</p><figure id="12da"><img src="https://cdn-images-1.readmedium.com/v2/resize:fit:800/1*EbjWsaj3kjzl-irJLK5NiA.png"><figcaption></figcaption></figure><h2 id="67fd">29) Largest per month</h2><div id="8f94"><pre>df = pd.DataFrame([
[<span class="hljs-string">'A'</span>, <span class="hljs-number">100</span>, <span class="hljs-number">110</span>, <span class="hljs-number">120</span>, <span class="hljs-number">130</span>, <span class="hljs-number">140</span>],
[<span class="hljs-string">'B'</span>, <span class="hljs-number">110</span>, <span class="hljs-number">101</span>, <span class="hljs-number">100</span>, <span class="hljs-number">135</span>, <span class="hljs-number">150</span>],
[<span class="hljs-string">'C'</span>, <span class="hljs-number">100</span>, <span class="hljs-number">140</span>, <span class="hljs-number">100</span>, <span class="hljs-number">135</span>, <span class="hljs-number">60</span>],
[<span class="hljs-string">'D'</span>, <span class="hljs-number">120</span>, <span class="hljs-number">130</span>, <span class="hljs-number">90</span>, <span class="hljs-number">121</span>, <span class="hljs-number">70</span>],
[<span class="hljs-string">'E'</span>, <span class="hljs-number">100</span>, <span class="hljs-number">110</span>, <span class="hljs-number">20</span>, <span class="hljs-number">30</span>, <span class="hljs-number">40</span>],
], columns=[<span class="hljs-string">'stock'</span>, <span class="hljs-string">'jan'</span>, <span class="hljs-string">'feb'</span>, <span class="hljs-string">'mar'</span>, <span class="hljs-string">'apr'</span>, <span class="hljs-string">'may'</span>])</pre></div><p id="c384">Write some code to find the largest value per month out of all 5 stocks, and display them in the format below.</p><figure id="ca9f"><img src="https://cdn-images-1.readmedium.com/v2/resize:fit:800/1*pYKeu9V0CBmmYjhxZUykVQ.png"><figcaption></figcaption></figure><h2 id="5dfd">30) Dealing with screwed up data</h2><div id="b735"><pre>df = pd.DataFrame([
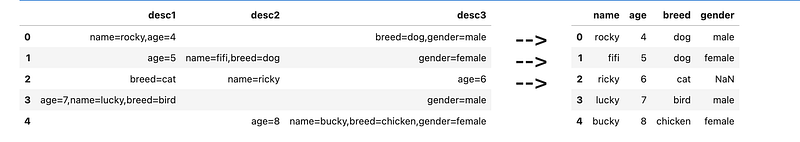
[<span class="hljs-string">'name=rocky,age=4'</span>, <span class="hljs-string">''</span>, <span class="hljs-string">'breed=dog,gender=male'</span>],
[<span class="hljs-string">'age=5'</span>, <span class="hljs-string">'name=fifi,breed=dog'</span>, <span class="hljs-string">'gender=female'</span>],
[<span class="hljs-string">'breed=cat'</span>, <span class="hljs-string">'name=ricky'</span>, <span class="hljs-string">'age=6'</span>],
[<span class="hljs-string">'age=7,name=lucky,breed=bird'</span>, <span class="hljs-string">''</span>, <span class="hljs-string">'gender=male'</span>],
[<span class="hljs-string">''</span>, <span class="hljs-string">'age=8'</span>, <span class="hljs-string">'name=bucky,breed=chicken,gender=female'</span>]
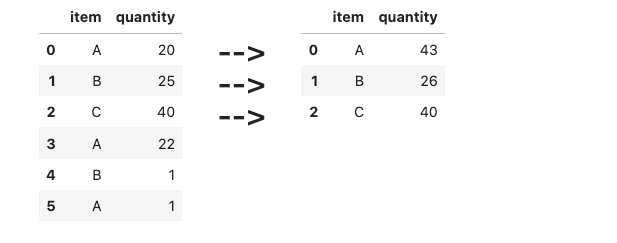
], columns=[<span class="hljs-string">'desc1'</span>, <span class="hljs-string">'desc2'</span>, <span class="hljs-string">'desc3'</span>])</pre></div><p id="a5b7">Clean the above (extremely messy) dataframe to get the dataframe below. Missing values should be converted to NaN.</p><figure id="2bd6"><img src="https://cdn-images-1.readmedium.com/v2/resize:fit:800/1*-s93qmKt9A7I9YfqbdcF6w.png"><figcaption></figcaption></figure><h1 id="02ae">Conclusion</h1><p id="67d9">Hope these questions were helpful in your practice!</p><h1 id="40ec">Some Final words</h1><p id="589a"><i>If this story provided value to you, and you wish to show support, you could:</i></p><ol><li><i>Clap multiple times for this story (this really helps me out!)</i></li><li><i>Consider signing up for a Medium membership using my link — it’s $5 per month and you get to read unlimited stories on Medium.</i></li></ol><p id="c59f"><a href="https://zlliu.medium.com/membership"><b><i>Sign up using my link here to read unlimited Medium articles.</i></b></a></p><p id="9d4b"><b>Get my free Ebooks: <a href="https://zlliu.co/books">https://zlliu.co/books</a></b></p><p id="9bc1"><i>I write Python articles (sometimes other stuff) that the younger me would have wanted to read. Do join my email list to get notified whenever I publish.</i></p><div id="d77a" class="link-block">
<a href="https://zlliu.medium.com/subscribe">
<div>
<div>
<h2>Get an email whenever Liu Zuo Lin publishes.</h2>
<div><h3>Get an email whenever Liu Zuo Lin publishes. By signing up, you will create a Medium account if you don't already have…</h3></div>
<div><p>zlliu.medium.com</p></div>
</div>
<div>
<div style="background-image: url(https://miro.readmedium.com/v2/resize:fit:320/0*IgpLf7o7RdjrLUuK)"></div>
</div>
</div>
</a>
</div><p id="4174"><i>More content at <a href="https://plainenglish.io/"><b>PlainEnglish.io</b></a>. Sign up for our <a href="http://newsletter.plainenglish.io/"><b>free weekly newsletter</b></a>. Follow us on <a href="https://twitter.com/inPlainEngHQ"><b>Twitter</b></a></i>, <a href="https://www.linkedin.com/company/inplainenglish/"><b><i>LinkedIn</i></b></a><i>, <a href="https://www.youtube.com/channel/UCtipWUghju290NWcn8jhyAw"><b>YouTube</b></a>, and <a href="https://discord.gg/GtDtUAvyhW"><b>Discord</b></a>. Interested in Growth Hacking? Check out <a href="https://circuit.ooo/"><b>Circuit</b></a>.</i></p></article></body>