
3 Tools to Monitor and Optimize your Linux System
Gain Control over your Machine with These 3 Tools
Motivation
If you are a Linux user, you might want to know some important information about your computer such as:
- System’s CPU usage, memory usage, and disk usage
- System information
- Disk usage of each folder or file and when was the last time that you used them.
- Memory and CPU consumption of the running processes
- Startup applications
Knowing those pieces of information will enable you to optimize your system.
In this article, I will show you 3 tools that allow you to do all of the things above and much more!
htop - an Interactive Process Viewer
htop is an interactive process viewer. htop allows you to view information related to command lines such as memory, CPU consumption, and how long it has been running.
I often use this whenever I notice a slow down in the speed of my computer and want to find out which processes have a major impact on the speed. I also use this to monitor how many cores and how much of the memory is being used when running a program or when training a model.
Packages for htop are available in most distros. To run htop, type
htopYou should see something like below:
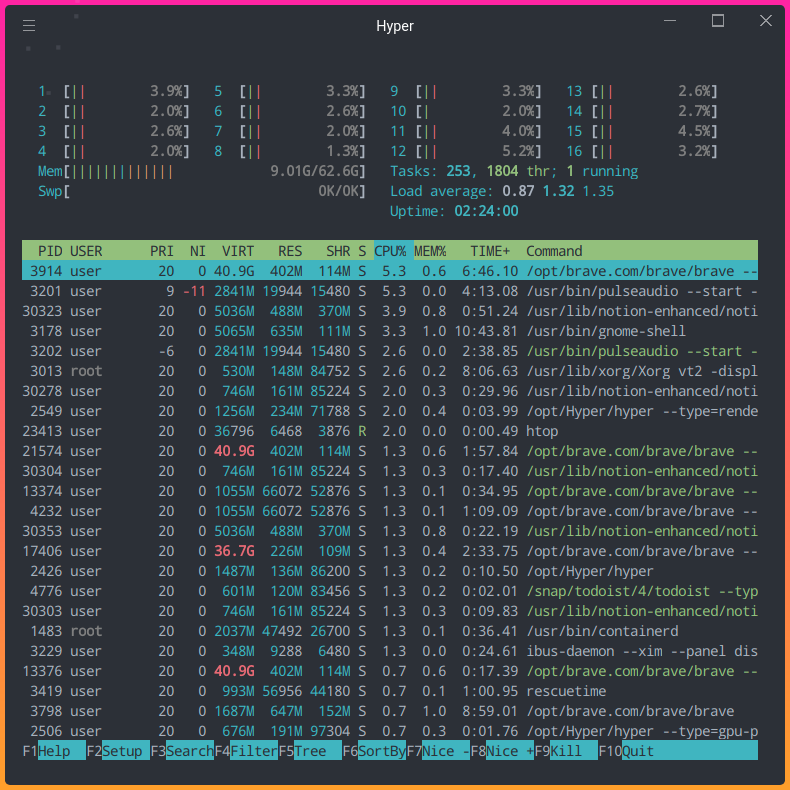
In the image above, the commands are sorted by CPU%. It seems like the process /opt/brave,com/brave/brave takes the most CPU consumption among all the running processes.
Several shortcuts to try:
F4: Show only processes whose names match the input textF5: Layout the relations between processes as a tree. Type+or-to expand or collapse a subtree.F6: On the sorted view, select a field for sorting.Home: Scroll to the top of the process list and select the first process.End: Scroll to the bottom of the process list and select the last process.
View the list of all shortcuts here.
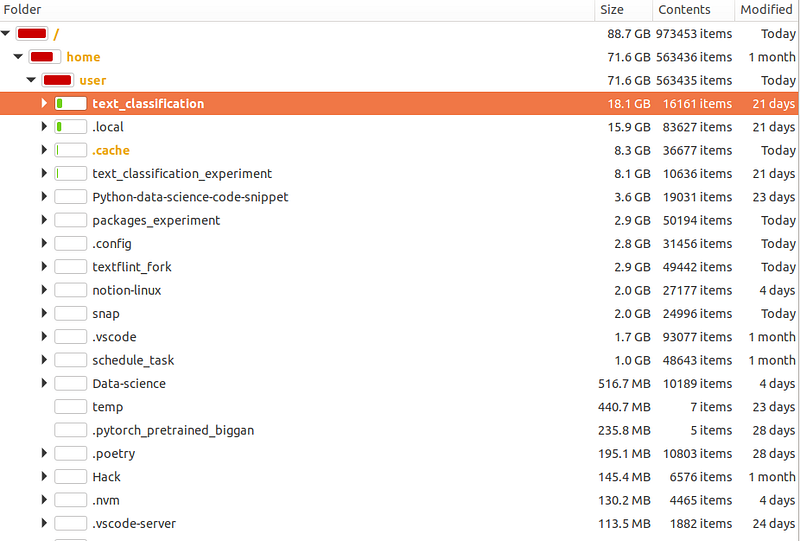
Baobab — Disk Usage Analyzer
If you want to get a graphical presentation of your disk usage, try Baobab. I often use this tool to figure out which applications take a lot of disk usage but haven’t been used for a while. Knowing this helps me to clean the files or folders that I no longer need.
Like htop, Baobab is also available in most distros. To run Baobab, type
baobabAnd you should see something like below:
By using the graph to visualize the disk usage of each folder and file, we have a much better understanding of which folders or files take the most disk usage in our computer.
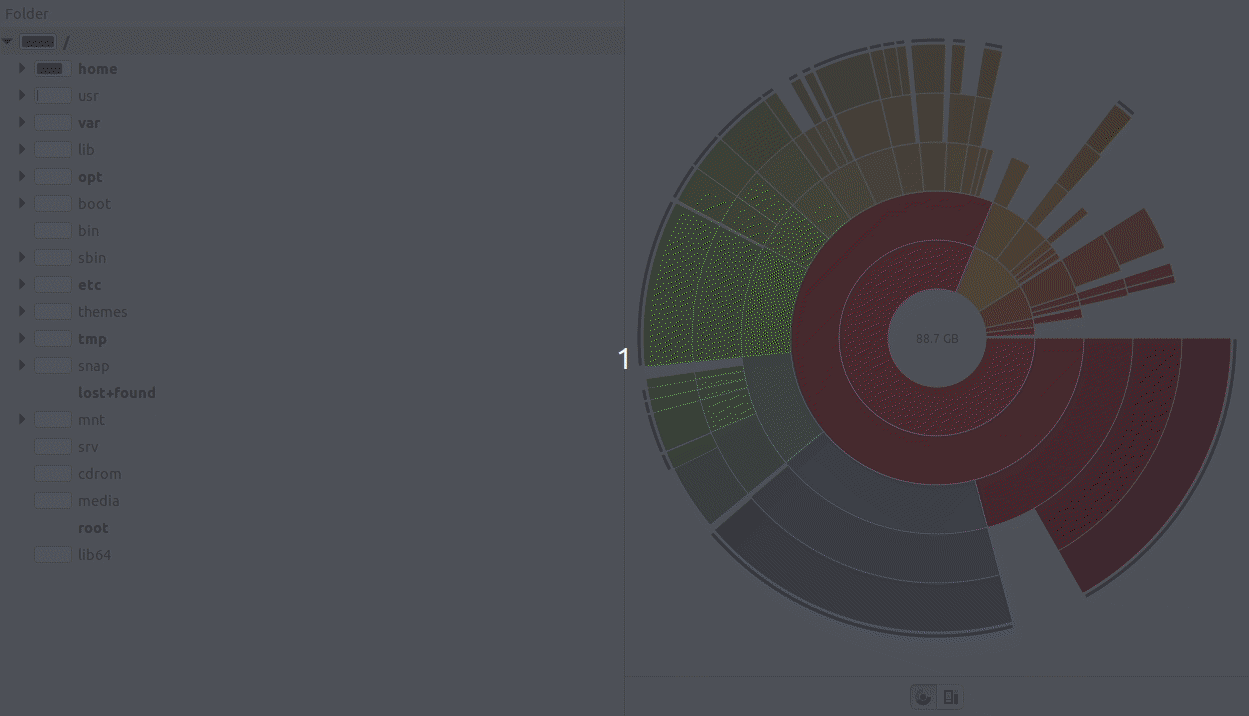
We can also see the size of the folders or files, how many files they have, and when was the last time they were modified.
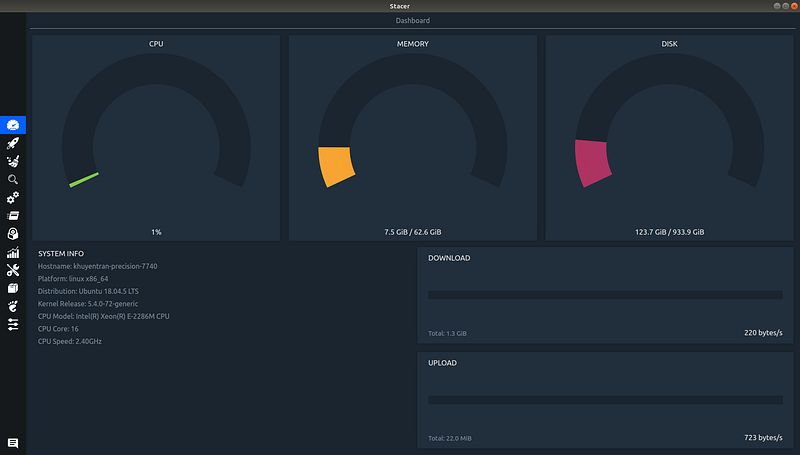
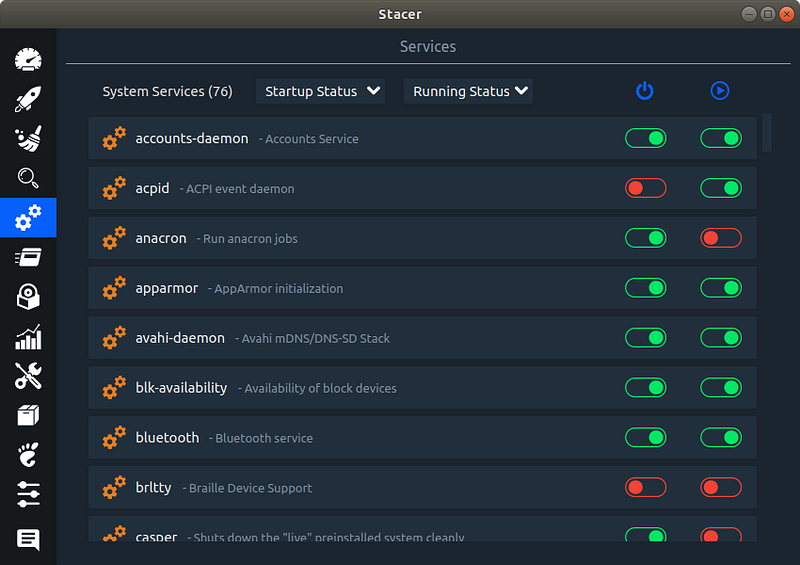
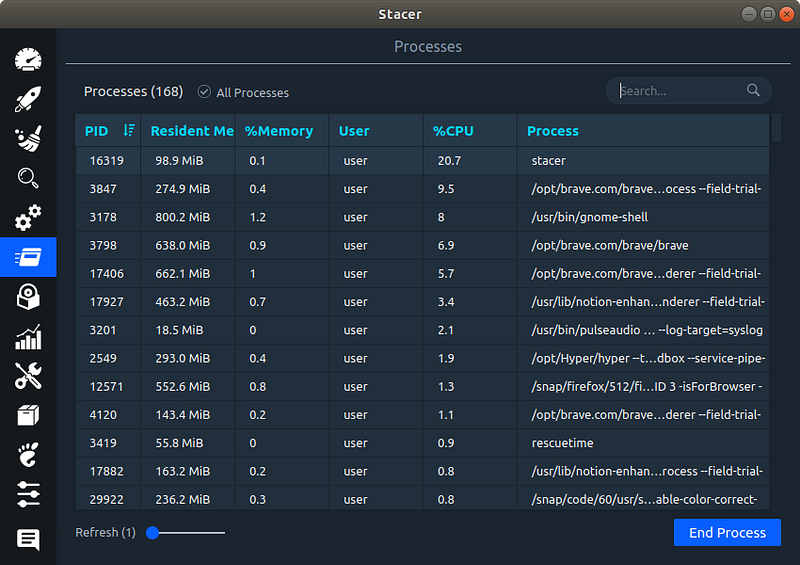
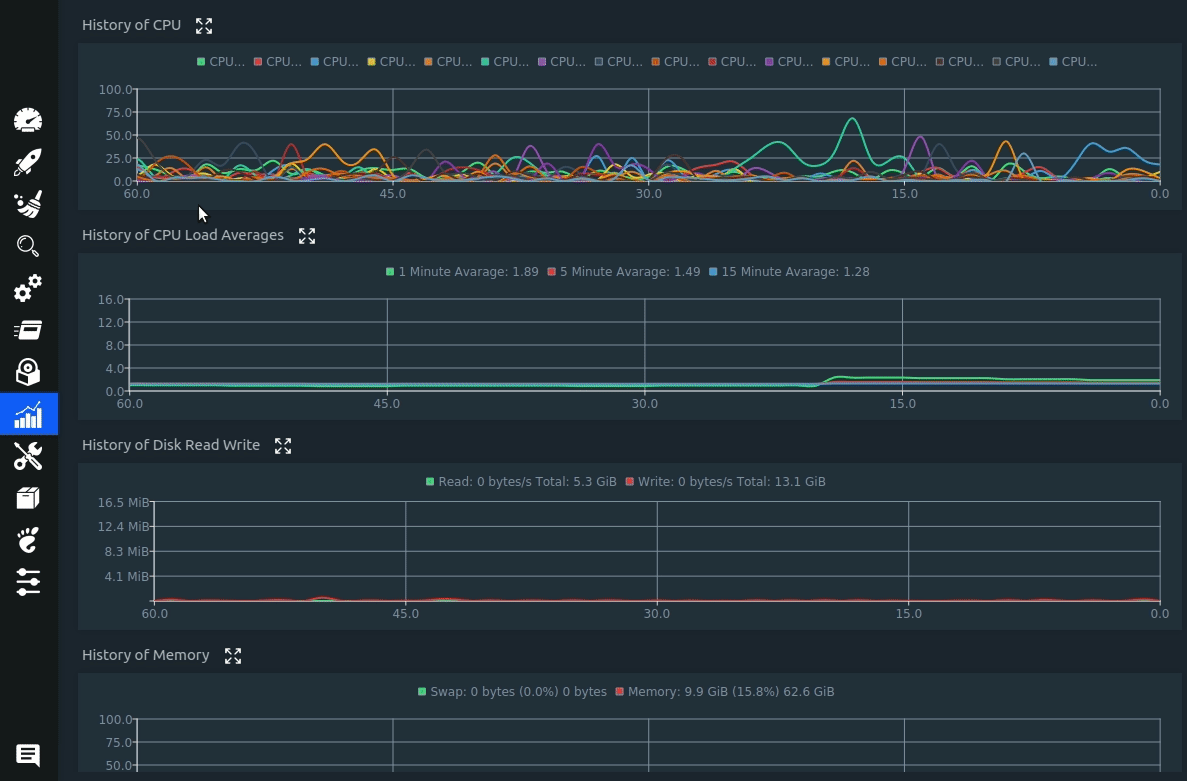
Stacer — System Monitor and Optimizer
Stacer is the tool that I am most excited about among the three tools I have introduced so far. It allows you to monitor many important pieces of information such as:
- System information
- Download and upload speed
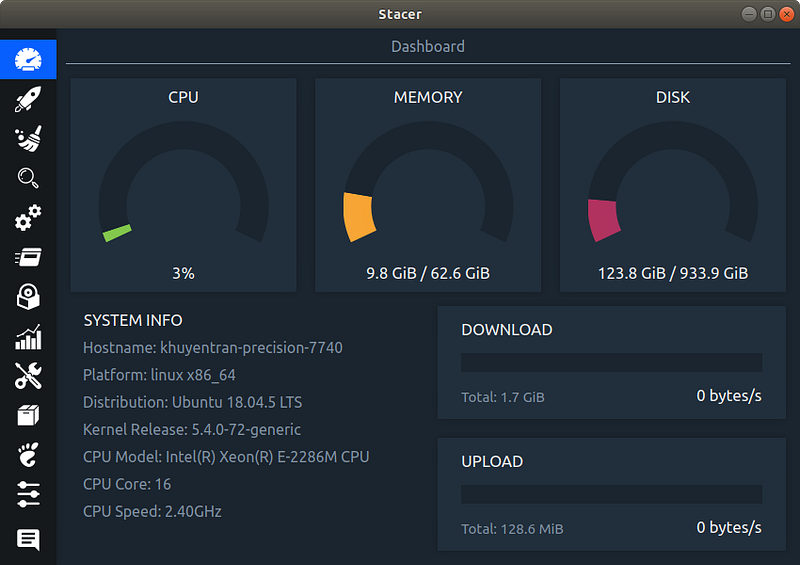
- Search
- System services
- Processes. You can consider this as a simple version of
htop. Even though it doesn’t give you as many options ashtop, it is easier to use and understand.
- Installed packages
- History of CPU and memory
Stacer also allows you to optimize your computer by:
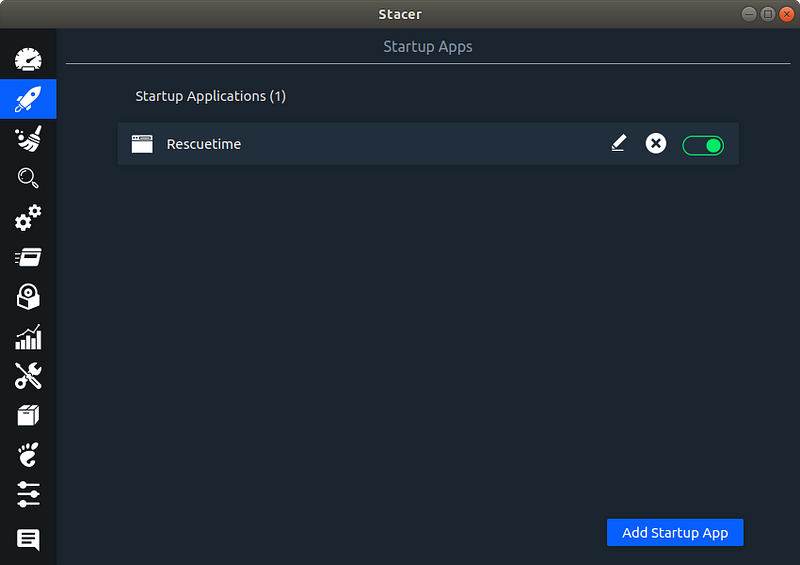
- Specifying which applications to start when your computer wakes up
- Cleaning the system
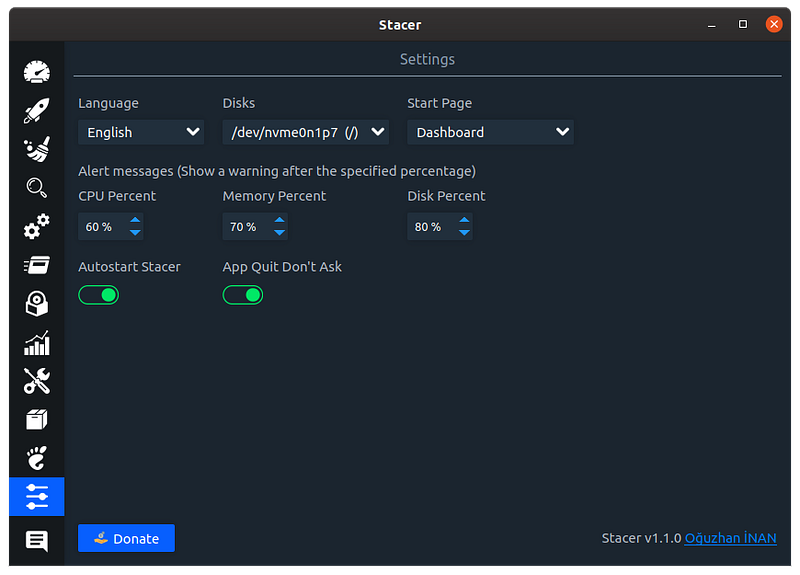
- Sending alert messages after the CPU percent, memory percent, and disk percent are below certain percentages
and much more!
You can find how to install Stacer here.
Conclusion
Congratulations! You have just learned how to monitor and optimize your Linux machine using htop, Baobab, and Stacer. Having more control over your machine will enable you to prioritize which tasks to run and remove unnecessary applications or processes.
I like to write about basic data science concepts and play with different algorithms and data science tools. You could connect with me on LinkedIn and Twitter.
Star this repo if you want to check out the codes for all of the articles I have written. Follow me on Medium to stay informed with my latest data science articles like these:


